A favourite Bloomberg function on the sell side seems to be SEAG . This function shows seasonality for a selected security and is popular among sales desks, particularly in quiet markets. Below is an example of the function for EURUSD 1year ATM volatility over the past 10 years.

It is apparent that January tends to be a soft month for vols while vols tend to increase in May.
In excel we can improve on this method by testing the statistical significance of this seasonality. The method that follows can be expanded to a wide variety of hypothesis that can be tested easily in excel.
To test for statistical significance we can set up a regression equation that tests the conditional mean of the observed changes in a security (in our example EURUSD 1y I.Vol) based on the month of a year. The equation to be tested is:
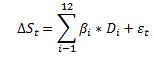
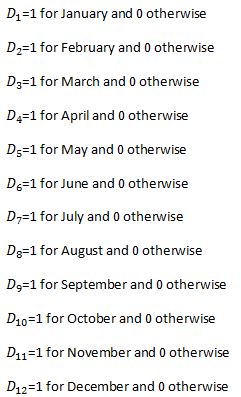
Where
With this set up each Beta coefficient is a test for any statistical significance of a seasonal pattern. This regression model can be easily set up in excel. It can be automated to update dynamically for different time series using LINEST function but here we will just show an example using Data Analysis functionality in excel.
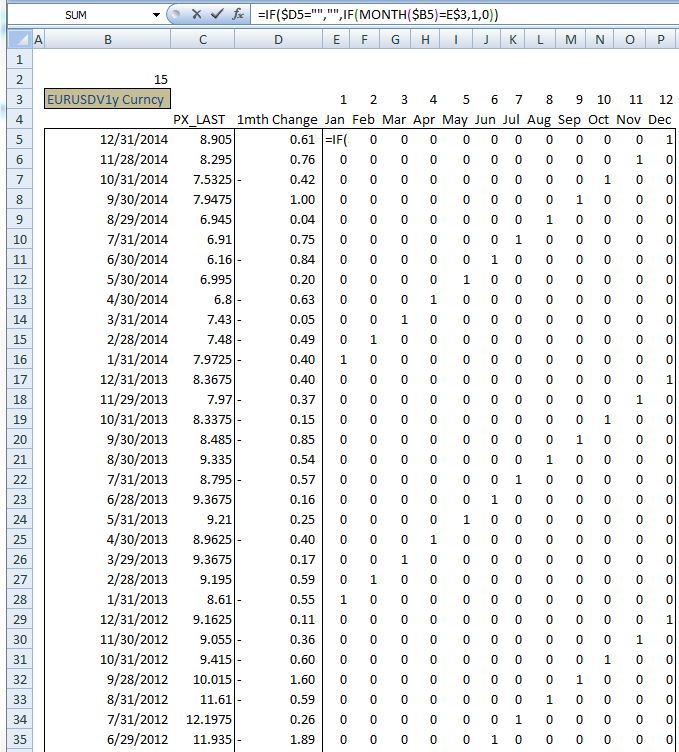
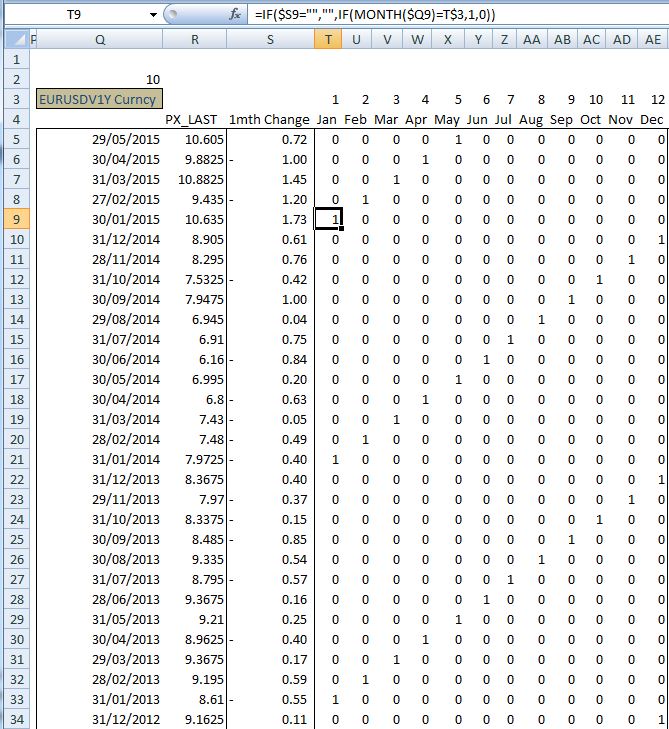
The first step is to set up the data in excel to run regression analysis.
1) Load in monthly data into a spread sheet. In the screen shot thats in column Q and R. In the column next to it calculate monthly changes in the implied volatility.
2) Now we need to add a column for each month where the first column equals 1 in the row where the month is January and zero otherwise. The second column equals 1 when the row is for the month of February and zero otherwise. Repeat for all the months. In the below screen shot we can use an IF statement to test the month and make the necessary calculation.
Now that we have our dummy variables set up we can run the regression model.
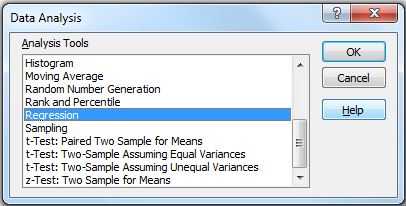
3) Go to Data ribbon and Data Analysis button. Select Regression from the list and press OK
4) Input the monthly change column range for Y Range and the dummy variables range in X Range fields. Make sure you select the column labels in the range and select the Labels checkbox. Also it is important to select Constant is Zero checkbox. Since we have 12 explanatory variables adding a constant will over-specify the regression equation and you will have erroneous results.

The output is presented below.
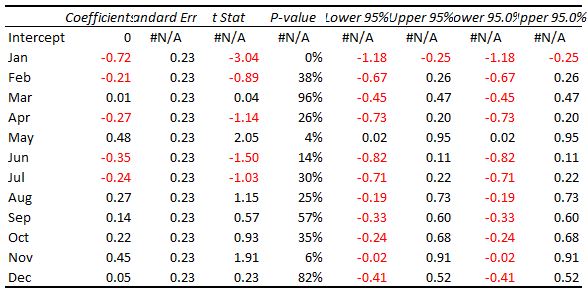
We can see that according to the p-value there is indeed a statistically significant seasonality in the implied volatility for the month of January, May, and November.
To help us visualize the results we can set up a graph of the coefficients that we have estimated along with the 95% confidence band. Adding some descriptive statistics can help with the analysis. We can also plot a time series for a selected month.

Some useful resources:
Excellent introductory econometrics book by Chris Brooks: http://www.cambridge.org/us/academic/subjects/economics/finance/introductory-econometrics-finance-3rd-edition?format=PB

Why is the input X range (Excel Data Analysis) is only from Jan to Nov? Not covering Dec?
LikeLike
good catch. my mistake while taking screenshots. select all the months and set intercept to zero.
LikeLike
Can you help me if this is the case: The dependent variable is PX_Last, what will be the independent variables be? From Jan to Dec or from Jan to Nov? Intercept not set to zero?
LikeLike
If intercept not set to zero you need to use 11 months not 12. but your interpretation of the coefficient changes. if you estimate model using feb to dec with intercept then the coefficient estimates how much higher or lower returns are in the other months OVER the jan returns. hope that makes sense
LikeLike
Thanks for the quick response. If I will only include Feb to Dec as independent variables, how would I know the p-value of Jan? If it is significant or not?
LikeLike
you are testing all other months returns over jan. if you are looking at monthly seasonality there is no reason to omit jan as a dummy variable. include 12 months and leave out the intercept
LikeLike
Thank you!!!
LikeLike
no probs
LikeLike
corrected now
LikeLike
thanks for this – very good explanation
LikeLike
enjoy
LikeLike
Dear brother
Could you please provide me with some detail about the software that used to do the example of the function for EURUSD 1year ATM volatility over the past 10 years
Thank you in advance
LikeLike
Good afternoon. Is it possible t have the excel file in order to study it?
LikeLike