Today’s post is a second in a planned series about the use of Principal Component Analysis (PCA) to manage risk and trade. In a previous post we tried to provide an intuitive explanation behind the method and a way to implement PCA in excel using a free addin.
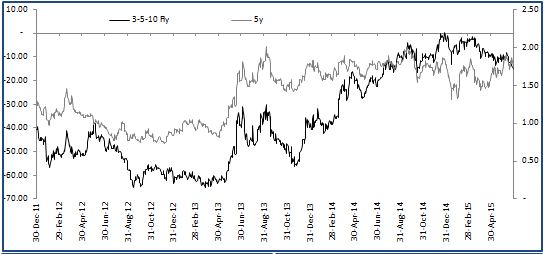
Today we want to show a PCA based butterfly trade using US interest rate swaps. In our discussion we will use a 3yr-5yr-10yr butterfly. The idea behind a butterfly is to position in a relative value trade by paying (receiving) in a center swap (the body) against a receiving (paying) position in the surrounding tenors (the wings). Most commonly traded butterfly trades are done on a 50:50 PV01 weighted basis. In this case if we pay in a 5yr swap in 50K of PV01 we would receive 25k worth of PV01 in 3yr and 10yr swaps. The trade is approximately PV01 neutral for parallel shifts in the curve. The trade is also approximately neutral in a steepening/flattening scenario. The trader is hoping to profit from changes in the shape of the curve. In our scenario, the trader is hoping to profit from an increase in 5yr swap rate relative to the 5yr and 10yr rate. Though traditional 50:50 PV01 weighted butterflies are common they are far from perfect relative value trades. There is considerable correlation between the butterfly spread and outright swap levels. Below is a plot of our 3s5s10s butterfly against 5yr swap rate. We can see that there is significant positive correlation between the two. A trader paying the belly in 3s5s10s butterfly ends up with risk that is equivalent to an outright long swap position. In many cases this is undesirable, especially for a relative value trade.

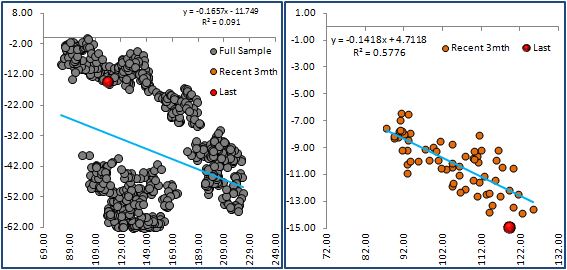
It gets worse still. If we look at the butterfly spread against the 3s10s slope we again see significant correlation. Below we can see that paying in the belly of 3s5s10s is similar to having a flattener on in 3s10s. Again, this may be undesirable for a relative value trade.

This is where PCA may be very useful for a relative value trader. In our previous post we mentioned that running PCA on a yield curve generates three principal components that describe most of the variability in the swap rates. Conveniently, the first factor can be interpreted as a level factor, the second is a slope factor and the third as a curvature factor. It is also important to remember that the three factors are orthogonal or uncorrelated. So if we wish to take a position in swaps where we profit from changes in the curvature of the yield curve while avoiding exposure to outright yield levels and the slope then we should structure a trade where we gain exposure to the third principal component only.
There are different ways to put on these kinds of trades. There is no way to know what the optimal way is. This is largely an empirical issue. We will follow the recommendations that have been outlined in a research piece by Solomon Smith Barney “Principles of Principal Components”
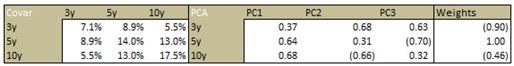
We first run PCA on a covariance matrix of outright swap levels (rather than changes in rates as we’ve done in a previous post). Also, we calculate the covariance matrix only for the swap tenors that we consider in the trade. There is little to be gained from calculating a covariance matrix for the full yield curve. In below we can see that the third principal component resembles the exposure that we are looking for in our trade. When the third factor increases the 3yr and 10yr swap rates increase while 5yr swap rate decreases. From our above discussion it should be clear that our goals can be achieved by take a position on the third principal component.
We can see from below that the third principal component is not correlated with the traditional 3s5s10s butterfly. A particularly attractive feature of taking a position in a PCA weighted butterfly is that it appears to be mean reverting. Currently the PCA weighted fly seems too low and a paying position in the belly looks attractive.

And as we mentioned before, it is not correlated with outright swap rates or the slope of the swap curve. Below we plot the third principal component (y-axis) against 3s10s spread and against 5s.

So now that we’ve talked about the attractiveness of setting up PCA weighted butterfly spreads versus traditional 50:50 butterfly we wish to show you the calculations behind the trade.
To put on a PCA butterfly we need to use the third principal component’s loadings as weights. In our case the loading for the 3yr is .63, 5yr -.70, and 10yr .32. To make the calculations tractable we normalize the middle loading. This is achieved by dividing each loading by -.70. Therefore our weight are [-.90,1.00,-.46]. Therefore, if our PV01 per 1mio notional for each tenor are [274, 482, 903] and we wish to have 50k PV01 exposure in 5yr swap then we need to pay 103.7mio in 5yr [50K/482], receive 164mio in 3yr [50k/200*.90] and receive 25.5mio in 10yr [50k/903*.46]
This structure is appealing from a variety of perspectives. Additional analysis reveals that the fly carries positively with carry and roll of 6.25bps running over the first 3 months. Also after fitting a mean reverting stochastic process we can see that the half life is 11 business days so the holding period is reasonable. The current z-score of the fly is -2.15. Our expected PnL on the structure is 5bps if it was to mean revert (not accounting for any carry that we earn)
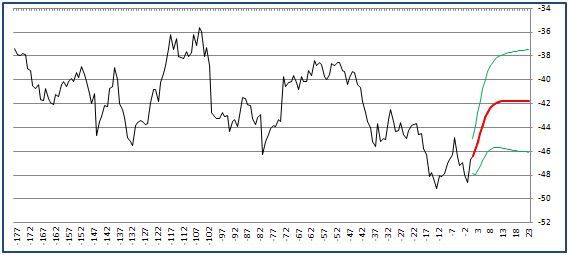
Below is a closer look at the fly

With the fitted mean revering model we can plot the expected path and its +/-2 standard deviation bands.
This type of analysis can be automated for all tenors including forward starting swaps. A systematic approach can highlight trade opportunities that would otherwise be difficult to identify.
Last point we wish to make is that PCA weighted butterflies are not without risk. Factor loading that we used as weights may become unstable if the covariance between swap rates changes. This will cause poor performance of the trade and may need rebalancing. Last point is that in the interbank swap market only traditional 50:50 weighted butterflies trade so your dealer may quote you a wider price on a PCA based butterfly.

what mean reverting model are you using for the pca fly in your article?
LikeLike
you can use this: https://en.wikipedia.org/wiki/Ornstein%E2%80%93Uhlenbeck_process
LikeLike
Hi,
Great article – thanks for posting it!
I had a quick question for you. Is the 3-5-10 PCA fly value/level in the graphs above calculated using the current weighting ( [-.90,1.00,-.46] in your example) for every date shown or using the historical weighting as calculated on each day displayed in the graph. To put it another way: from the graph, the value of the 3-5-10 PCA fly on 30th Dec 2011 is approx. -44.5 – is this value calculated using [-.90,1.00,-.46] or the weighting calculated on 30th Dec 2011?
thanks,
Simon
LikeLike
Hi,
Thanks for posting this – great article!
I had a quick question. Is the value/level of the 3-5-10 PCA fly on the various dates shown in the graphs above calculated using the ‘current’ weighting ([-.90,1.00,-.46] in this example) or the historic weighing on each of the dates? To put it another way: for example, the value of the 3-5-10 PCA fly on 30-Dec-2011 is approx. -44.5 – is this calculated using a weighting of [-.90,1.00,-.46] or using the historic weighting calculated on 30-Dec-2011?
thanks,
Simon
LikeLike
Hi Simon,
I had exactly the same question as yours with regards to the historical PCS fly graph (against the 50:50 fly)
I haven’t seen any response to whether one should calculate the historical weights as we go along, or simply using todays weights and keeping them unchanged for the backdating fly spread evolution?
Have you heard any confirmations please? would you recalcuate the weights on each day?
can you please advise if you’ve heard back from anyone who knows.
Many thanks
LikeLike
can you please give a clue as to how to incorporate the stochastic process to the fly. An equation perhaps. thanks awesome article.
LikeLike
Hi Simon,
I had exactly the same question as yours with regards to the historical PCS fly graph (against the 50:50 fly)
I haven’t seen any response to whether one should calculate the historical weights as we go along, or simply using todays weights and keeping them unchanged for the backdating fly spread evolution?
Have you heard any confirmations please? would you recalcuate the weights on each day?
can you please advise if you’ve heard back from anyone who knows.
Many thanks
Zahar
LikeLike
Have same question as Zahar + Simon! Reviving this thread if anyone still wondering? 🙂
LikeLike
I think that the -3/+5/-10 PCA Fly it is just calculated with the PCA performed in the last period and using today’s weights and keeping them unchanged for the backdating fly spread evolution.
The logic I find behind this, is that the PCA ponderation is the strategy that “bets” for the average curvature movement, and that average is defined today, hoping that tomorrows behaviour of the curve is similar to that one period.
Btw, I can´t replicate that graph, I think I am missing how the yield pick-up / fly is calculated.
Thanks! 🙂
Raul
LikeLike
Can there be a correlation between a 4:3:1 schatz bobl bund butterfly and the german 2s5s10s PCA-weighted butterfly?
LikeLike
Hi!
Thank you so much for these posts! I am finding them so useful!
I would like to know how you´ve built the -3/+5/-10 PCA Fly. I´ve tried several ways but can´t get that same graph (nor uncorrelations).
Could you (or anyone) give me an explanation or clue?
Thanks 🙂
Raúl
LikeLike