Hodrick Prescott (HP) filter is a method to decompose a time series into two components, a long-term trend and a residual. The residual is interpreted as a cyclical component. The formula is as follows:

where y is the time series we are considering and g is the growth rate, while c is the cyclical part of the time series. The exact specification of the HP filter is:

While it looks complicated the above equation has an intuitive interpretation. The objective of the minimization is to find a trend component g that does not deviate from observed time series y too much. This is the first part of the minimization function. The second part of the equation penalizes us for having an erratic long term growth component. The penalization is weighed by the lambda parameter which the user should specify. Typically in economic literature lambda of 129,600 is used for monthly time series, 1,600 for quarterly time series, and 6.25 for annual frequency.
To implement HP filter in excel we need to solve below system of equations:

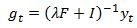
where I is in identity matrix while F is a Pentadiagonal matrix

solving for g we get:
For a small problem we can tackle it directly via built in excel functions. For example using 25 quarterly observations of Singapore’s seasonally adjusted GDP in range C6:C29 and a Lambda parameter of 1600 we can name the lambda range as “Lambda” and the GDP time series as “Y_t”

In range I5:AF28 we can input matrix F and in range AI5:BF28 we can input the identity matrix I
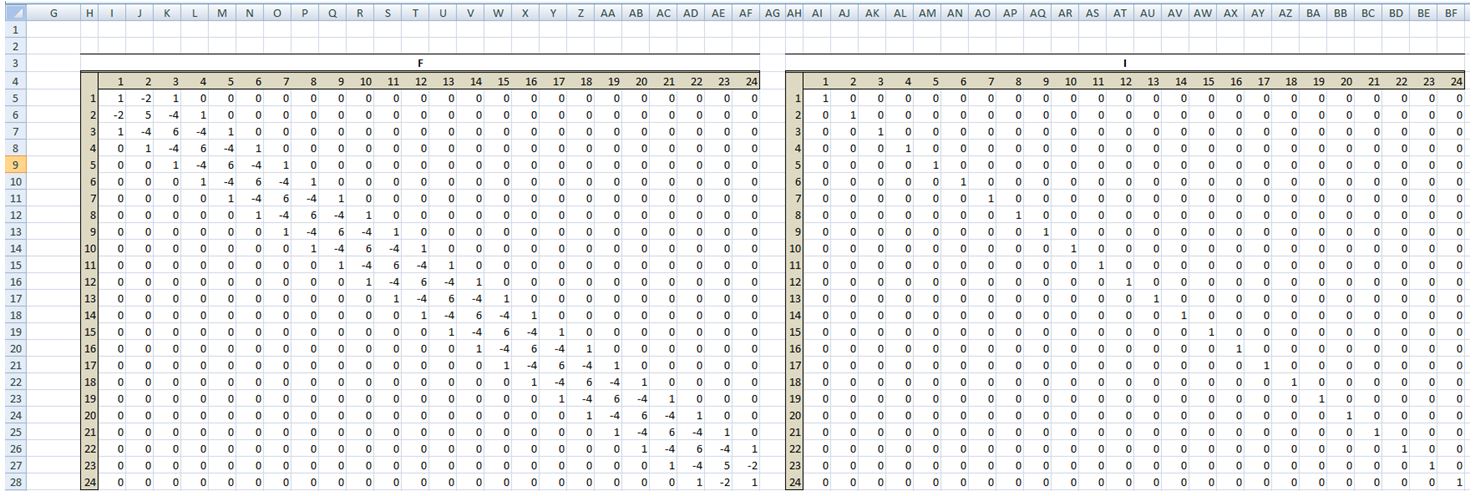
We can calculate Lambda*F matrix in range I33:AF56
And we can finally calculate in range AI33:BF56 the matrix needed for inversion and name the range as LambdaF_plus_I

To calculate the HP trend component we simply use MINVERSE function in excel to find the inverse of LambdaF+I matrix and MMULT function to multiply the inverse by observed GDP series. The cyclical component is simply y-g

Above was obviously a toy example outlining basic calculations with some unnecessary steps included to help with the exposition. If we wish to implement HP filter in excel we will need to build a systems of equations solver in VBA. First thing to notice is that the matrices are sparse so we can implement more efficient system of equations solver instead of relying on computationally expensive matrix inversion. Our problem can be stated as a Pentadiagonal system of equations. Exposition below borrows heavily from Numerical Mathematics and Computing by E.Cheney and D. Kincaid.
A Pentadiagonal system of equations is a system of equations with following representation:

The pseudo code to solve this system is given by E.Cheney and D. Kincaid. It is an excellent book and worth having nearby when implementing numerical methods.
In VBA the function looks like this:

To use the function simply enter HP_Filter(YourDataRange, Lambda) and press Ctrl+Shift+Enter to input the array function. For example using Singapore’s seasonally adjusted GDP dating back to 1980 we first take the log of the time series. Then use our HP_Filter function with lambda of 1600 to estimate the trend. We then transform the trend back by taking the exponent. The result is plotted below.

To check the cyclical component we simply subtract the growth from observed GDP (both in log terms) to see what the current output gap is.

Finally as a check we run hpfilter in matlab to check our results.

Our output for the same first 15 observations matches.

Some useful resources:
- Wikipedia entry for HP Filter: https://en.wikipedia.org/wiki/Hodrick%E2%80%93Prescott_filter
- Hyeongwoo Kim note on HP filter: http://www.auburn.edu/~hzk0001/hpfilter.pdf
- Numerical Mathematics and Computing by E.Cheney and D. Kincaid: http://www.amazon.com/gp/product/1133103715/ref=pd_lpo_sbs_dp_ss_3?pf_rd_p=1944687542&pf_rd_s=lpo-top-stripe-1&pf_rd_t=201&pf_rd_i=0534389058&pf_rd_m=ATVPDKIKX0DER&pf_rd_r=1EEFGACEPSCX192V5M5M

Great job. Thanks!
LikeLike
Enjoy
LikeLike
Foarte eficient!
LikeLike
Brilliant, thank you!
LikeLike