Today we wanted to show a quick and easy implementation of event analysis in excel. The literature on this topic is large with most of the research concentrating on the stock market. Event analysis research attempts to test for excess returns on stocks which announce stock split, surprise on their earnings announcement, or stock response to any other corporate event. Here we will attempt something different. We will test for patterns in FX market going into and out of nonfarm payrolls. After we present the calculations in excel we will post VBA implementation of a function that can execute the necessary calculations so that we can automate the analysis for any other events we wish.
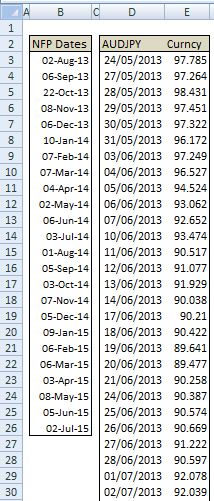
To start with we will need the date of our events and price data. In a spreadsheet NFP dates are in column B. For our example we will look at AUDJPY price series. The data is in columns D and E.
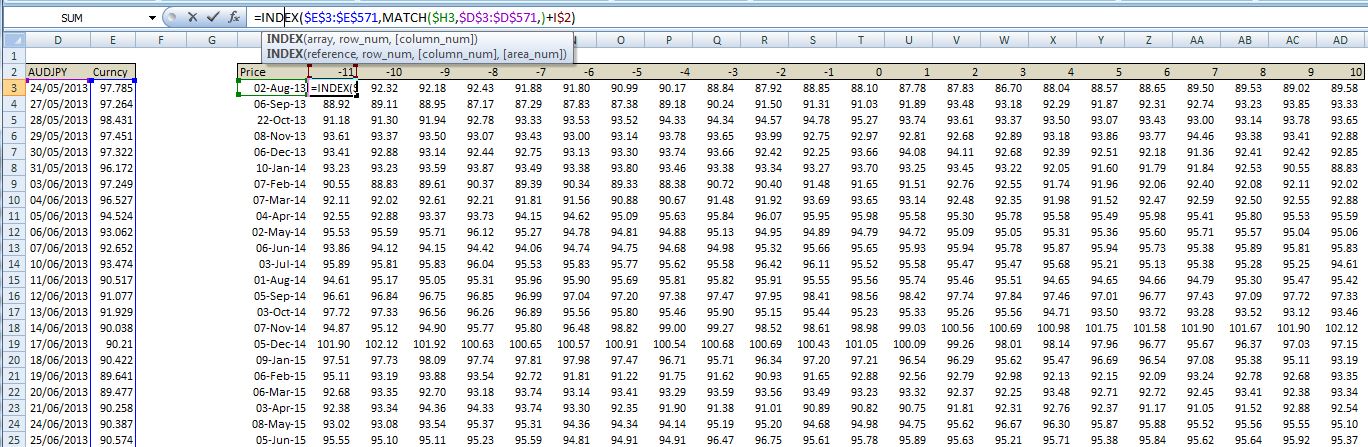
We can then align the data around each NFP date so that we can calculate returns before and after the release. In this case we will look at 10 day returns going into NFP and 10 days after.
To accomplish this we set up a table with the first column holding the NFP dates and columns next to it looking up the price data for that event date with an offset. For example in the selected cell I3 we are finding the row number of the event date in the table holding our AUDJPY daily observations. This is done via the MATCH function. After finding the row date we subtract the number of days we are attempting to offset. In this case it is 11. Now that we have the row of the event date and have offset it by 11 we can look up what price value that row holds via the INDEX function. Note that the data needs to be in ascending order for this method to work. We can then copy and paste this function into the remaining cells of the table to get the results shown below.
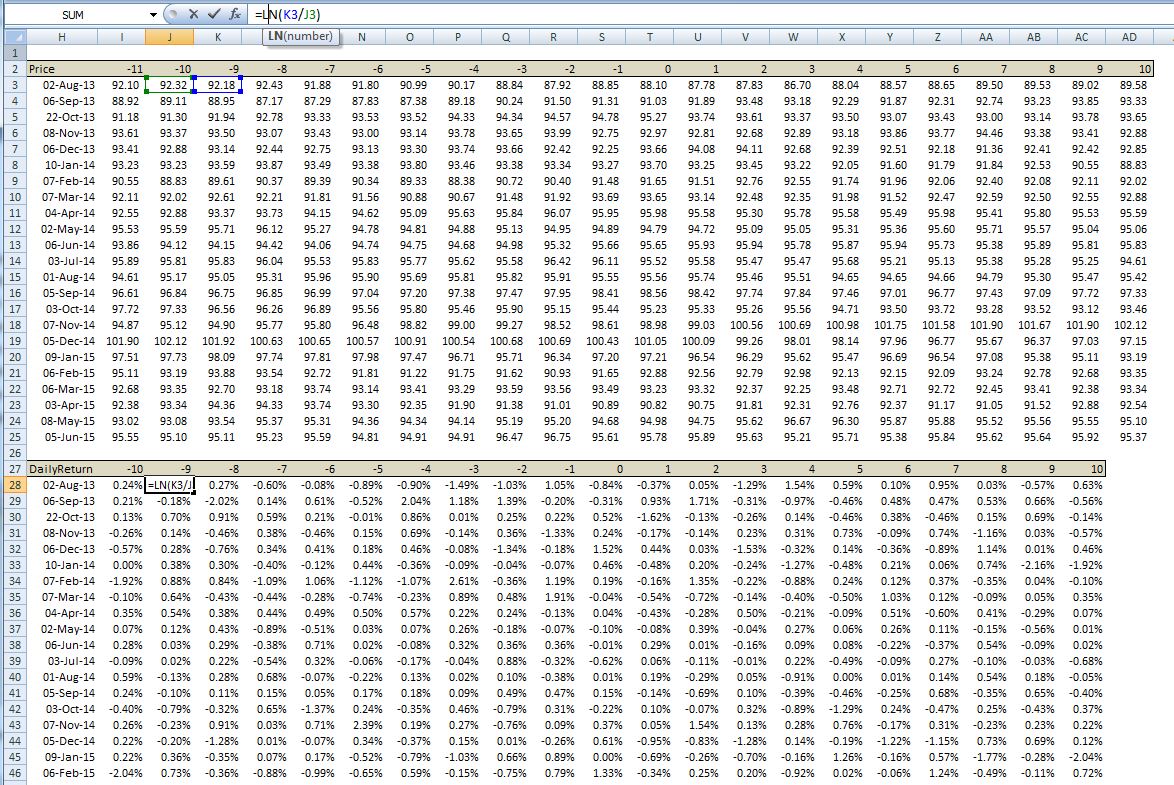
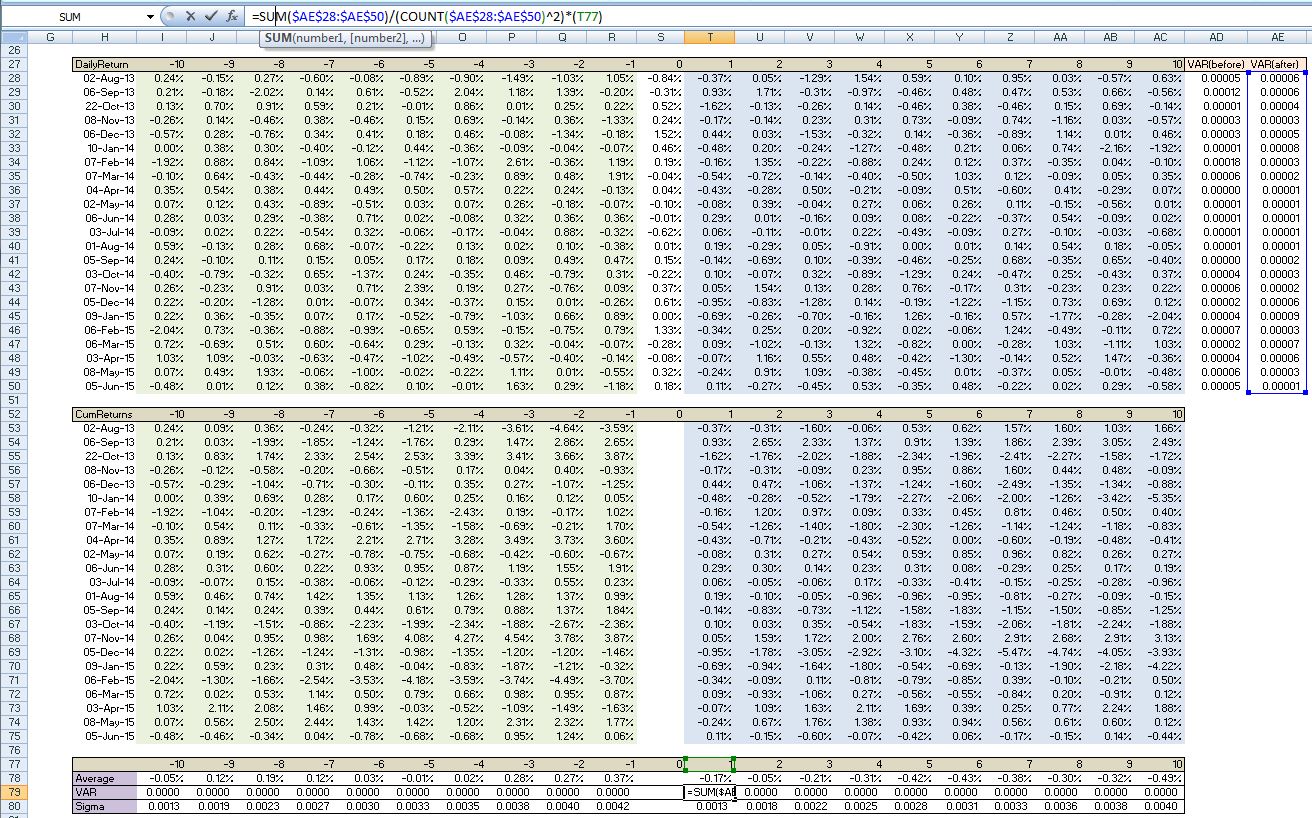
Once we have our price data we need to calculate daily returns. Here we calculate lognormal returns.
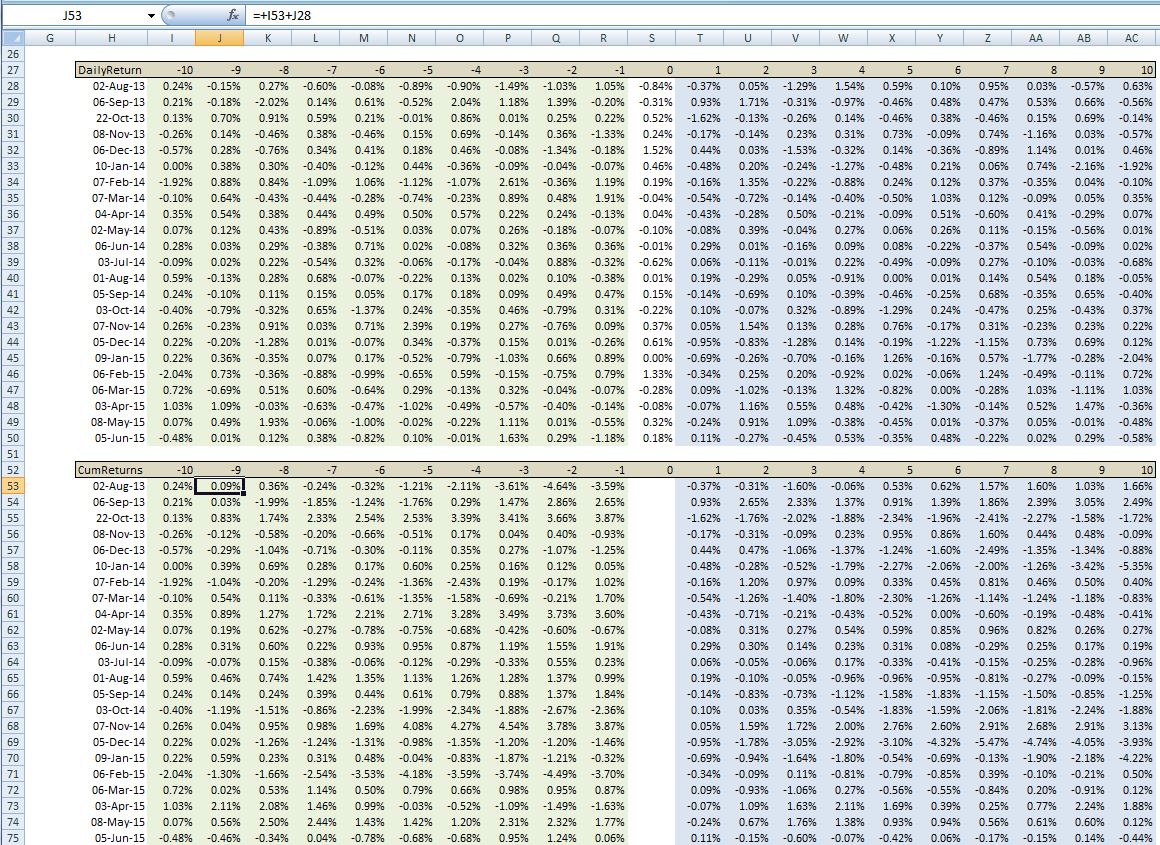
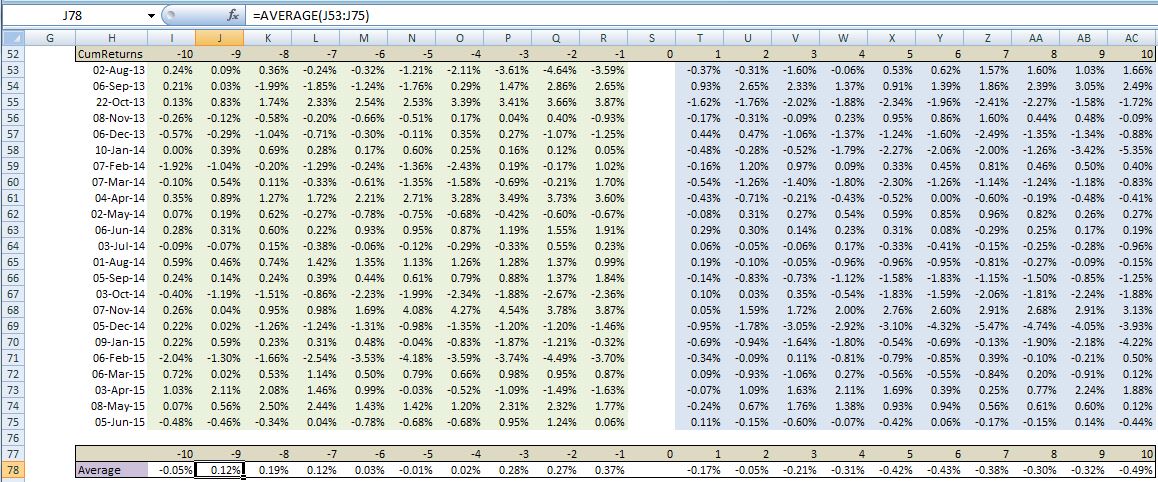
What we are interested in is the behaviour of AUDJPY into and out of NFP. To do this we can calculate cumulative returns into and out of the event (excluding the event itself). Therefore we need to calculate the cumulative returns for each event (ie row). Below is the table that does this. The green range are the cumulative returns going into NFP and blue range are the cumulative returns after the NFP release.
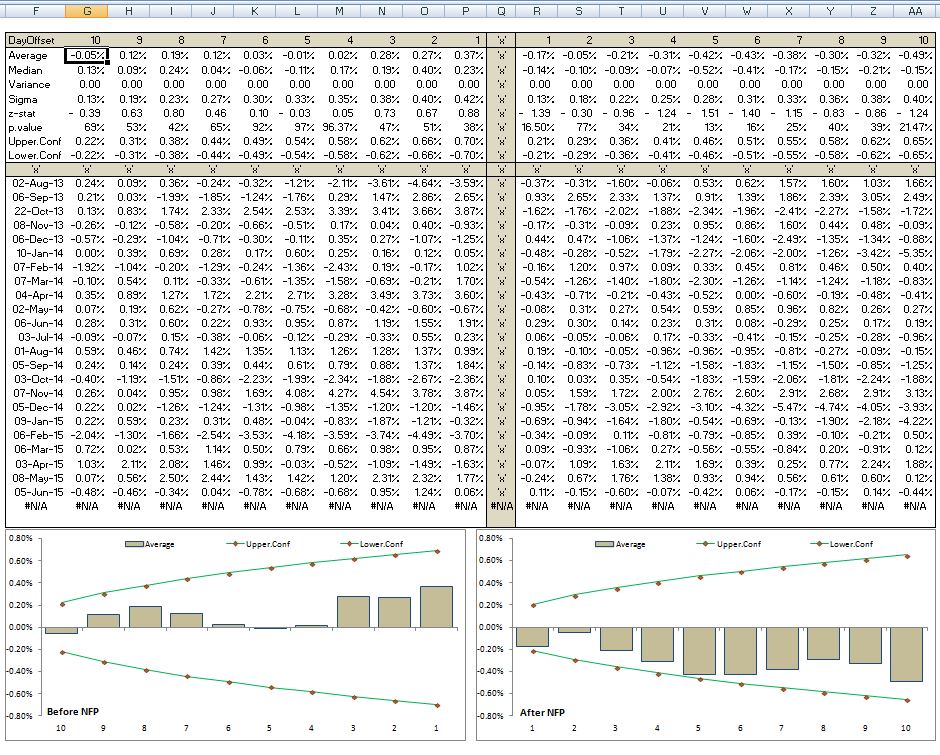
We can now calculate the average cumulative return for each offset period across all events. This is done in row 78.
Now we would like to test statistically to see if these cumulative returns are statistically different from zero. To accomplish this we need make some strong assumptions. First we will assume that the returns are normally distributed and are not correlated. We should note that this assumption is more likely to be true when the time series does not include overlapping events. This is the case here since every event is a month apart and we are looking at data 10 days around each event.
With these assumptions variance of each average cumulative return is given by
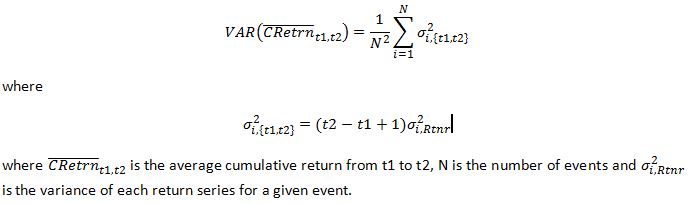
First we compute the variance for each event series in column AD and AE
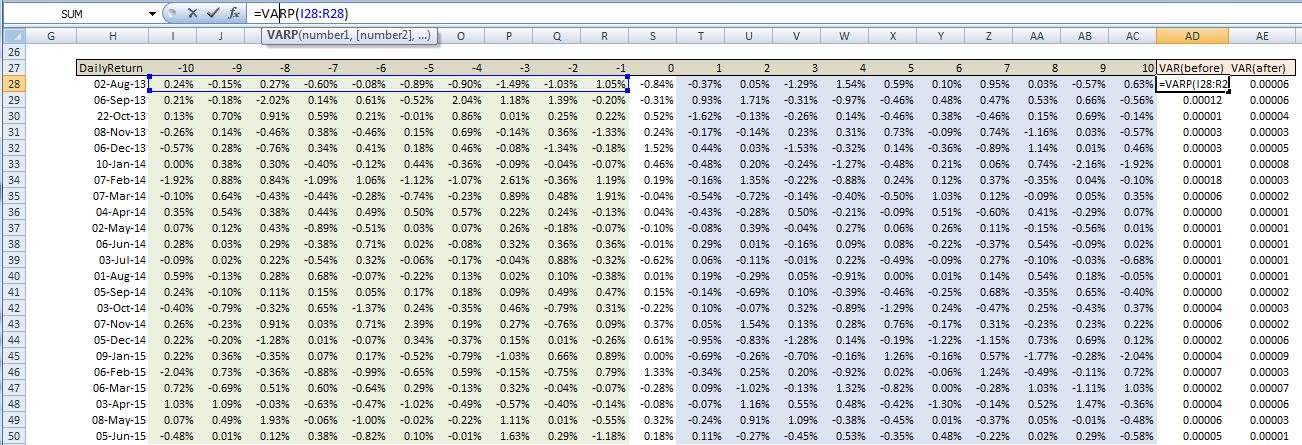
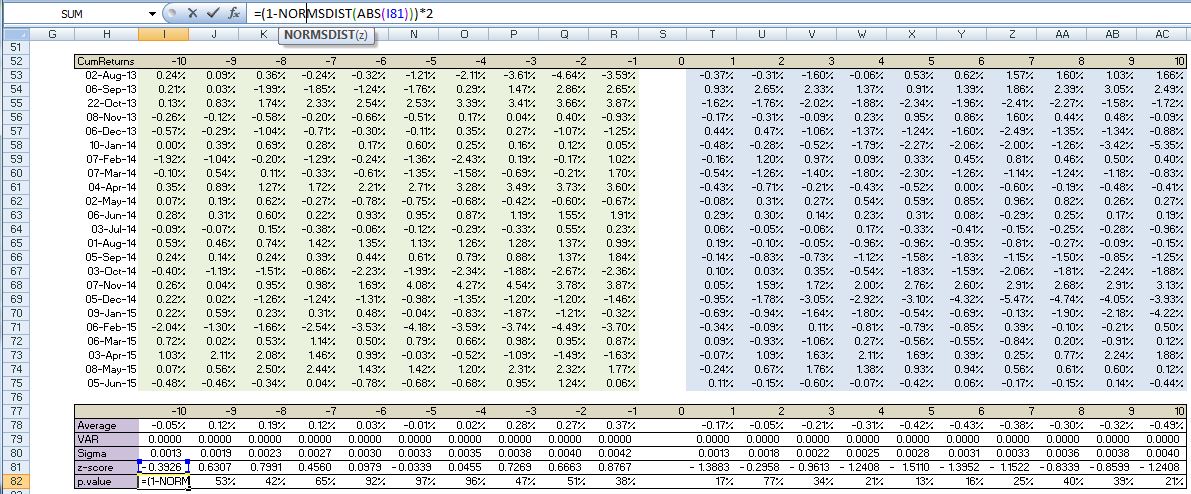
We can now calculate the variance for each average cumulative return in row 79. In row 80 we simply take the square root of the variance to get the standard deviation.
The variance for the data series after NFP needs to be calculated as:
o test to see if our calculated average cumulative returns are statistically significant we need to calculate a test statistic. In our case the test statistic is simply the average cumulative rerun divided by the standard deviation. This statistic is assumed to be normally distributed so we can calculate a p value (probability that the average cumulative return is different from zero) using excel’s NORMSDIST function. We do that in row 82 after calculating the test statistic in row 81.
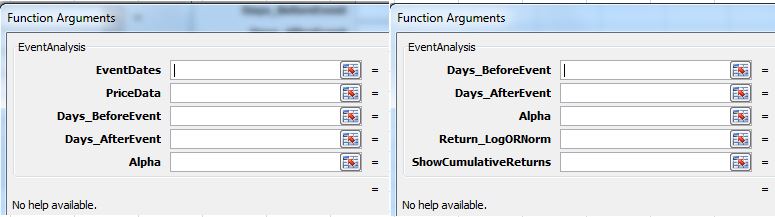
Below we present a VBA function that takes as input a range with:
– Event dates
– PriceData range which includes dates and prices in ascending order
-Days_BeforeEvent that we wish to consider and Days_AfterEvent that we want to analyse
-Alpha which is used to construct upper and lower confidence band for the cumulative returns.
-Return_LogORNorm which is a string argument which calculates daily returns using Lognormal returns if argument is “Log” or as simple difference if “Norm” is selected (norm is used for interest rates usually)
-ShowCumulativeReturns is Boolean. Default is TRUE. If set to TRUE then cumulative returns for each event are returned by the function. If FALSE is selected only summary statistics are returned.
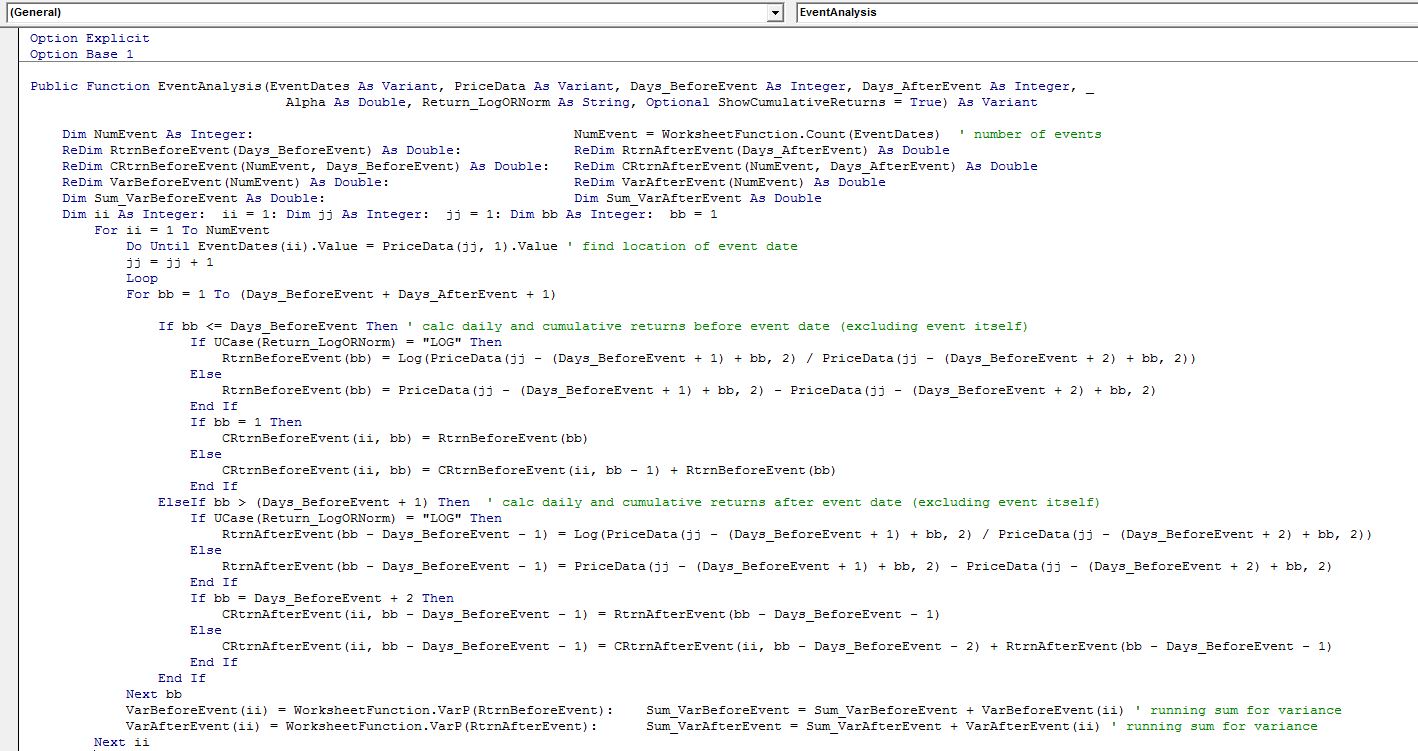
The function should be input as an array function by pressing Ctrl+Shift+Enter after all the arguments have been input.
First part of the function loops through each event and calculates returns and cumulative returns.
Second part of the function calculates the test statistics and also inserts some place-holders to format the table so that it is easier to read.

The final output looks like below:
This type of analysis can be done very quickly with this function for major events that are coming up. We can also repeat the analysis on the event of a day and condition the table on the results of the event. For example, in a hypothetical case of NFP coming out above expectations we can filter only those events when NFP surprised to the upside and repeat this exercise while looking only at the table that reports statistics after the event. This way we can quickly identify statistically significant pattern in the cumulative returns if there are any.
We presented here a simple example of event analysis. There are many ways to construct the tests and different kind of test statistics. An excellent discussion can be found here http://press.princeton.edu/titles/5904.html or here http://www.palgrave.com/page/detail/event-studies-for-financial-research-doron-kliger/?isb=9781137435385. The last source presents examples of excel implementation of different statistical tests.

Can you provide me the excel file/vba program that you used above? I badly need such type of program for my research work.
LikeLike