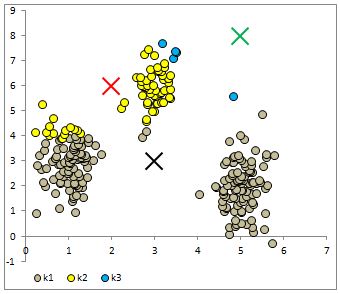
In this post I wanted to present a very popular clustering algorithm used in machine learning. The k-means algorithm is an unsupervised algorithm that allocates unlabeled data into a preselected number of K clusters. A stylized example is presented below to help with the exposition. Lets say we have 256 observations which are plotted below.

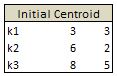
Our task it to assign each observation into one of three clusters. What we can do is to randomly generate 3 cluster centroids.
We can then proceed in an iterative fashion by assigning each observation to one of the centroid based on some distance measure. So if an observation has the least distance to the centroid k1 then it will be assigned to that centroid. Most common distance measure is called the Euclidean distance. This is a measure of the straight line that joins two points. More on this distance measure here https://en.wikipedia.org/wiki/Euclidean_distance.
The formula for a Euclidean distance between point Q =(q1,q2,q3,…qn) and point P=(p1,p2,p3,…pn) is given as:
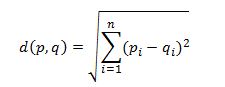
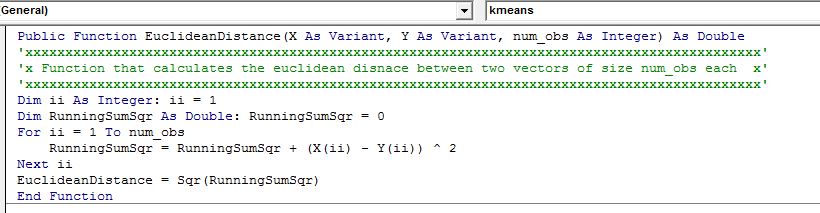
We can implement this measure in VBA with the below function that takes two arrays and the length of the arrays as input to compute the distance.
In our example we have two features for each observation. Starting with the first we have x1=-.24513 and x2=5.740192

Using the first observation we can calculate the distance to each of the centroids. For the first centroid we have sqrt((-.24513-3)^2+(5.740192-3)^2) = 4.25. We can then calculate the distance to the second centroid as sqrt((-.24513-6)^2+(5.740192-2)^2) = 7.28. And finally the distance to the third centroid is sqrt((-.24513-8)^2+(5.740192-5)^2) = 8.28. Now, since the minimum distance is between this object and the first centroid, we will assign that object to the first centroid cluster.
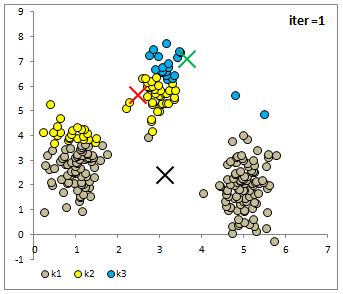
After repeating this process for all of the 256 objects we have all the objects assigned to one of three clusters. I plot them below with different colours along with each centroid.
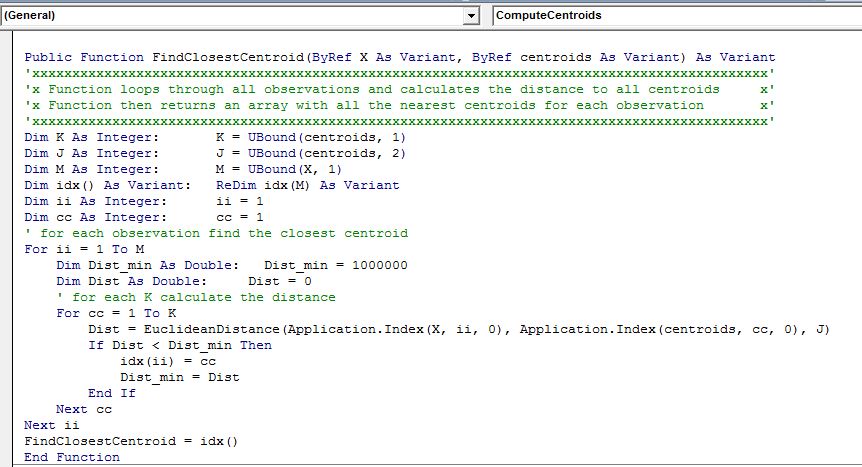
We can loop through all of our objects and calculate the closest centroid in VBA using below VBA function that returns an array that is the same length as our object array with each entry being between 1 to K.
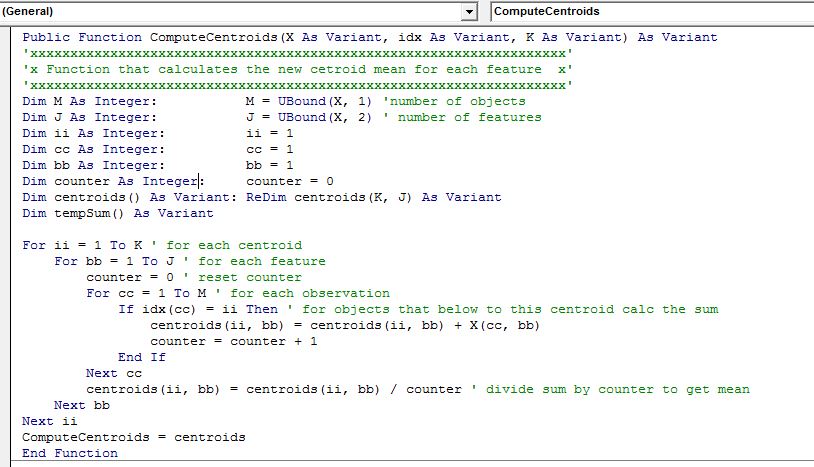
At this point we move on to the next step of the iterative process and recalculate the centroids for each cluster. That is, we group our data by the cluster that they have been assigned to and then take the average for each feature of that cluster and make the value of each centroid.
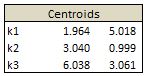
In our example we get below results.

In VBA we can accomplish this with the below function:
We can again calculate the distance between each object and the new centroids and reassign each object to a cluster based on Euclidean distance. I have plotted the results below:
Notice that the centroids have moved and the reassignment looks to improve the homogeneity of the cluster. We can repeat this process until a maximum number of iterations have completed or until none of the objects are switching a cluster.
Below are a few more iterations of the algorithm so you can see the dynamics of the cluster assignment and centroid means.

As you can see that after only 5 iterations the clusters look sensible. I want to remind you that we only specified the number of clusters we are looking for and the algorithm found the clusters for us. This is an example of an unsupervised machine learning algorithm.
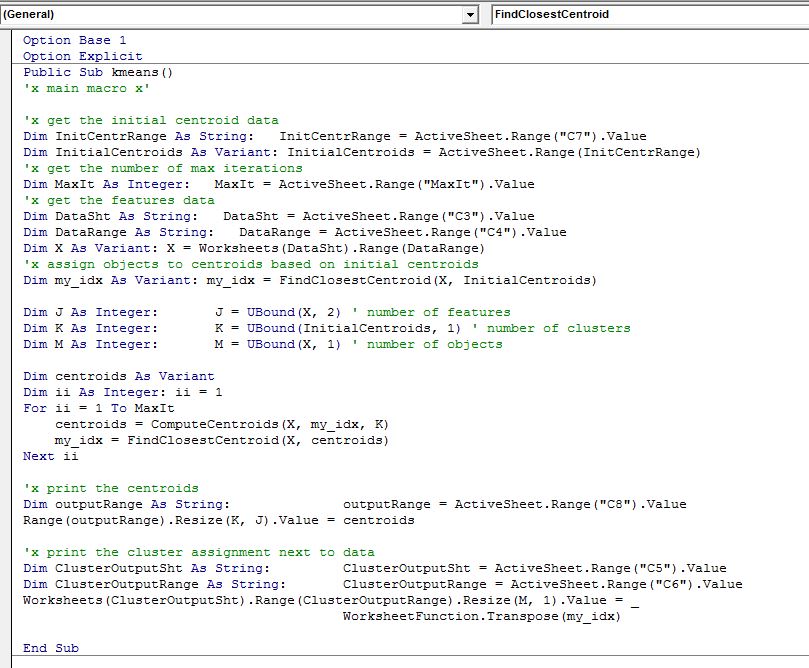
Notice how simple the final loop of the algorithm is. After loading in the data and building the above functions, we simply loop through the calculations a preset number of times with the code below:
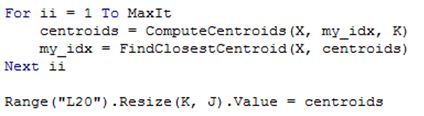
The centroids are returned to L20 range. In our example after 10 loops we have
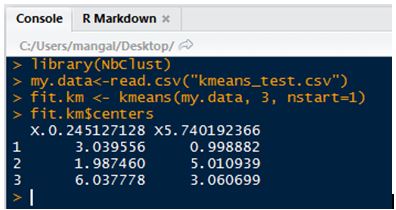
We can check our work with R’s NbClust package.
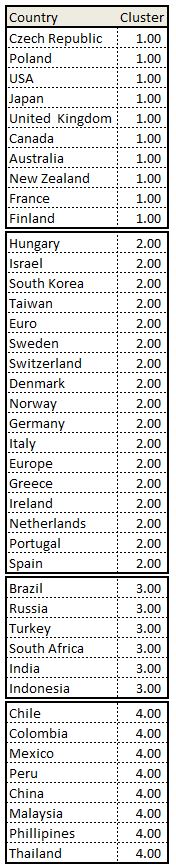
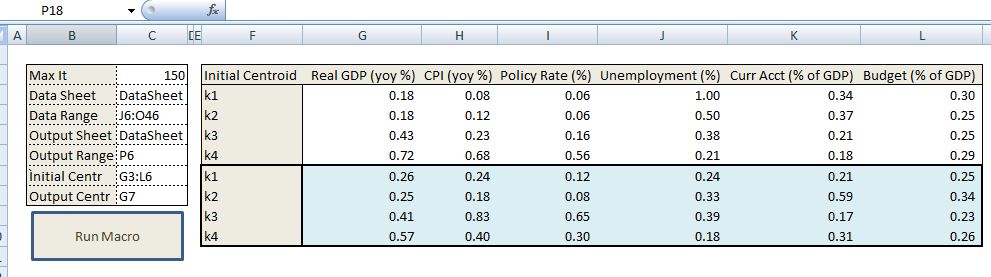
For another example of k-means clustering we can use this approach to cluster countries based on analyst forecast of some macro variables. For example we can compile a list of countries and consider bloomberg consensus forecasts for GDP growth, inflation, CB policy rate, unemployment rate, current account balance as a ratio of GDP, and budget deficit. Let’s say we wish to cluster these courtiers into four clusters for further analysis and we wish to discard conventional clusters used in the markets such as geographical, development status, or other marketing based conventions (BRIC being an example).

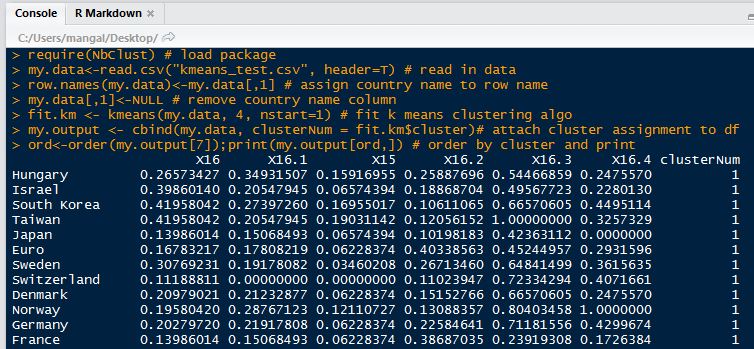
At this point I should highlight what is probably already obvious, we need to standardize the data. When features have different scale our distance measure will be dominated by the relatively large features. Therefore each cluster will be based on that dominant feature instead of all features being weighed equally. Here, for each feature, we can simply subtract the minimum from each observation and divide by the range (max-min) of its values to standardize. Below is our processed table:

The other important point is that instead of using arbitrary random starting points for each class we should select 4 random objects for the starting centroids. After running the k-means algo we end up with below clusters.
After we have the clusters the hard work begins. We can check what yields, curve spreads, FX forwards, implied vol in FX and rates are within clusters and how they compare with other clusters. Any outliers can then be further analysed to check for potential trades.
A final note of caution. The k-means algorithm is sensitive to starting values we chose for each centroid. Also, the a priori choice of k determines the final result. It is worthwhile to run the algorithm multiple times to check how sensitive the results are to the starting values. Many implementations of k-means run the algorithm multiple times and select the clustering based on some metric such as total dispersion in the data (ie, sum of squared distances between each object and its centroid).
In this post I just wanted to introduce the k-means algorithm and show how easy it is to implement it. All the modeling can be done in a day. Building a model for yourself can bring a lot of insight into how the algorithm works. For serious applications one should stick to better implementations such as R. This type of analysis can be done with just a few lines of code:
If you’ve been following along and want to know the complete VBA implementation, below I show you the main k-means procedure that calls the user defined functions mentioned above. I also present the main worksheet and I believe you can figure out where the data is read from and where the output is printed from the code.
The worksheet that calls the macro is below. The user needs to point to where the data is, where you wish for the output to be printed, the maximum number of iterations and the initial centroid values.
The macro button calls below macro:
Some Useful Resources:
1) Wikipedia entry is a great place to start https://en.wikipedia.org/wiki/K-means_clustering

Thanks a lot to Bquanttrading. This is ultimly fascinating, to see results even on random data. But what is purpose to show only VBA code pictures? Just lose time to OCR.
Any case – thanks one more time
LikeLike
to encourage writing out your own code. its likely there are mistakes. i believe that you should write your own code so you understand it and catch bugs. thats why i dont upload code or workbooks.
LikeLike
Hi Bquant in the above code for ComputeCentroids – Tempsum is not used and the Sub kmeans() code crashes at If idx(CC)=ii
Dim tempsum() As Variant
For ii = 1 To k
For bb = 1 To j
counter = 0
For CC = 1 To m
If idx(CC) = ii Then ??
Is it possible to get the correct code or a copy of the spreadsheet with the same data for validation ? Many thanks Peter U
LikeLike
As I can get the fix matrix, could you give us an orientation?
Dim tempsum() As Variant
Thank you very much
LikeLike
Did a minor change in ComputeCentroids and this should work:
For ii = 1 To K
For bb = 1 To J
counter = 0
For cc = 1 To M
If idx(cc) = ii Then
centroids(ii, bb) = centroids(ii, bb) + X(cc, bb)
counter = counter + 1
End If
Next cc
If counter > 0 Then
centroids(ii, bb) = centroids(ii, bb) / counter
Else
centroids(ii, bb) = 0
End If
Next bb
Next ii
ComputeCentroids = centroids
LikeLiked by 1 person
Hi, please copy of Excel workbooks sample files of this tutorial.
LikeLike
Greetings bquantrading,
Just wanted to shout out a big THANK YOU for posting this article and breaking down the kmeans process in VBA. I used your process to create a clustering program for lat/long data. Then I used power query to “draw” lines between the k and the related coordinates. It looks pretty good on 3D Maps in Excel. Thanks again.
Jake
LikeLike
Hi, could someone upload a working version of this code in a new comment?
LikeLike
Is it possible to share the file to understand it better?
LikeLike