I have spent a month running around Toronto and Tokyo so did not get a chance to post earlier on the nasty PMI print coming out of US but decided to comment at this time so I can tie to my earlier post on ridge regression modeling.
There is not much positive to say about this print of 48.60. Looking at the details, New Orders Less Inventory declined and that’s probably the most important statistic outside of the headline index. Below is a breakdown of the subcomponents.
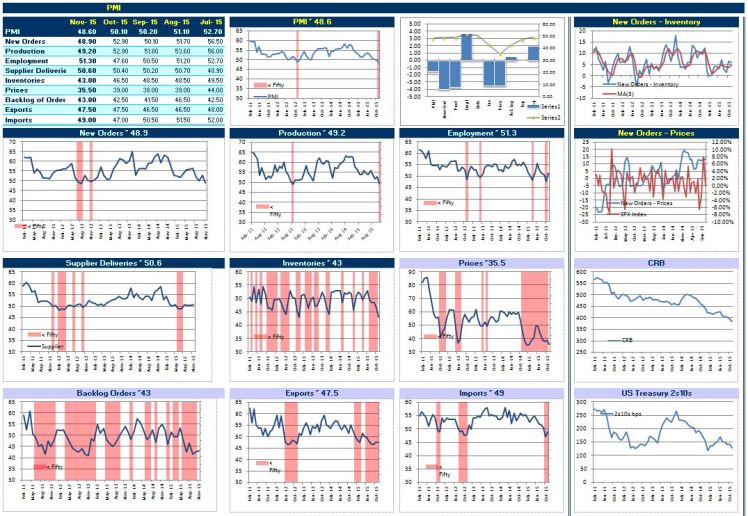
But everyone has seen the ugliness and probably already forgot about it. Today I just wanted to discuss some of the details about the PMI headline Index and how we can try to improve on it using ridge regression.
The main PMI index is constructed as an equally weighted average of the New Orders, Production, Employment, Supplier Deliveries and Inventories sub-indices. There is nothing special about these weights of .20% for each sub-index. We can try and construct our own statistic using the ISM’s release that better captures the underlying strength or weakness of the manufacturing sector.
To begin we first need to consider how we use the PMI, ie what information are we actually gleaning from the report. Different users will answer this question in their own way. I would argue that most of us use it as a fuzzy real time forecast of GDP. In other words, GDP is a function of PMI or GDP=f(PMI). An analyst may produce a nowcast of GDP by running a quick regression model as:
Since we know that PMI is constructed as an equal average of the five sub-indices:

this means that the resulting regression model is a constrained OLS estimate.

We can try to improve this model by estimating a set of unique coefficient for each sub-index to construct a statistic that improves on the headline PMI index. The model we can estimate is:

Before we do that I should highlight that the GDP release is quarterly but ISM releases the PMI on a monthly basis. Analysts usually will incorporate this information by using a moving average. This is another example of a constrained parameter model. Using an average we have:

If we wish to incorporate the entire quarter’s information to construct a nowcast of GDP we can assign a unique coefficient for each lag in the model. This will result in the following regression equation:

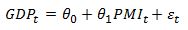
We can add the other sub-indices into our analysis instead of the five that ISM includes. I also added an additional lag term. Therefore in addition to the above model we add Export and Import indexes and one more lag for each sub-index for a total of 29 coefficients (including a constant). The analysis that follows was done in R but many aspects can be replicated by using the ridge regression function I wrote about in my last post. Now, first thing we should note is that the data is highly correlated. Below is a correlation matrix for quarterly observations:
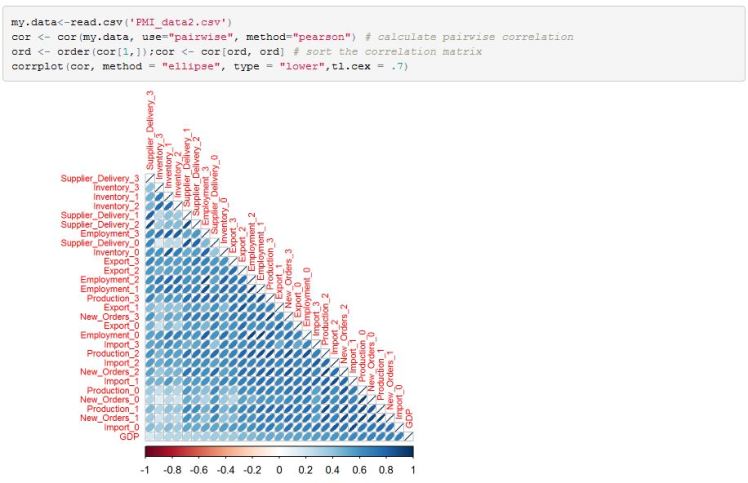
As I mentioned in my previous post, ridge regression helps us deal with multicolinearity by allowing us to search for a model with penalized coefficients that trades off an increase in bias for variance reduction and therefore a possibly better predictive model. Below is a profile of the 10-fold cross-validation based on different values of the shrink parameter alpha:
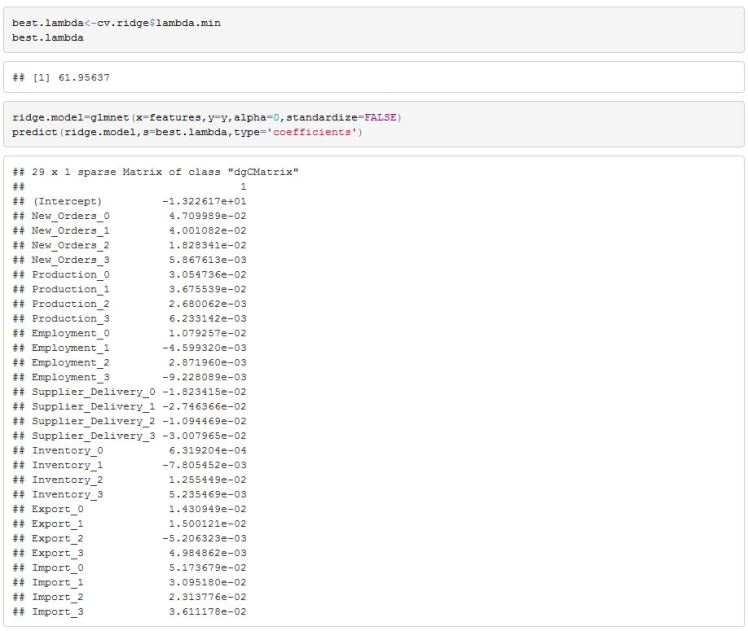
The “best” lambda that we achieve is 61.96. Best here is defined as the lambda that produces the lowest cross-validation mean squared error. The estimated coefficients are presented below:
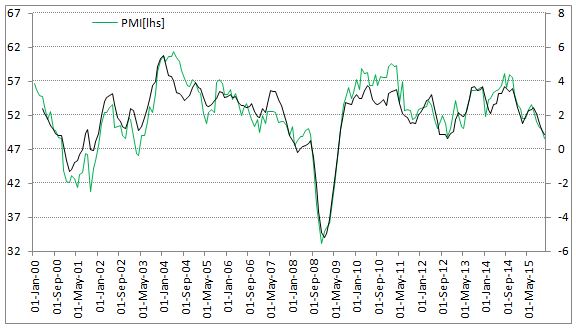
We can now set up this index in a spreadsheet and follow the new nowcast model in addition to the PMI index. Below are the two indices. Our model confirms the ugliness revealed early in December.
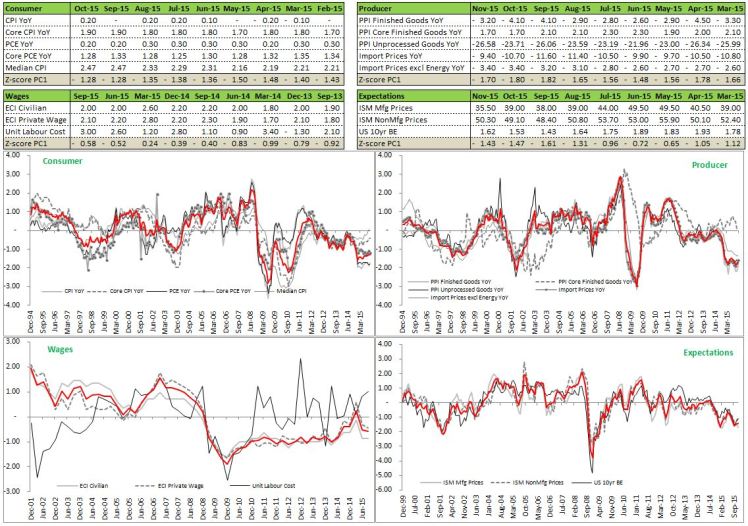
This is particularly worrying since we are coming into the FED hike with little sign of Inflation and weakness in the manufacturing sector. I previously discussed PCA based inflation filtering and present updated results below. Consumer price measures have picked up somewhat but still well below historical average. Meanwhile wages, production and expectations are still trendless and hanging out below the long term average.
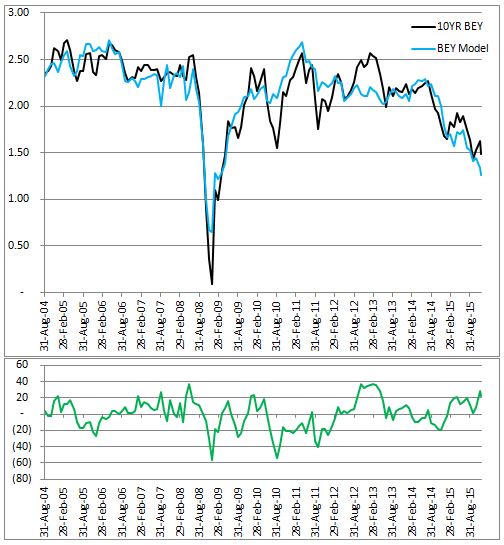
At the same time, my toy model for 10yr breakevens showing that there is more room below.
Some Useful Resources:
1) Very good book on US economic indicators that discusses how ISM’s PMI is constructed and how to interpret it. There is lots more information in the book than just the PMI and is a great resource. http://www.amazon.com/Secrets-Economic-Indicators-Investment-Opportunities/dp/0132932075/
2) A paper by Rolando F. Pelaez that constructs an alternative to PMI based on a regression model. “A Reassessment of the Purchasing Managers’ Index” http://nabe-web.com/publib/be/0304/030435.pdf
3) R’s glmnet vignette https://web.stanford.edu/~hastie/Papers/Glmnet_Vignette.pdf
