Today’s post is about a phenomena observed in many “naturally” occurring data collections that can be exploited in accounting fraud detection. This phenomena is referred to as Benford’s Law and is named after Frank Benford who popularised it. The original discovery is actually credited to Simon Newcomb.
The main idea is that leading digits in a collection of numbers present themselves in a distribution that is different from what we would typically expect. Therefore, when numbers such as accounting entries are manufactured by managers they will typically deviate from a distribution that occurs in non-manipulated data. An analyst can then perform statistical analysis on leading digits of accounting data to test for possibility of accounting fraud.
As a concrete example, I loaded in historical quarterly Income Statement and Balance Sheet data for S&P 500 Energy Sector Stocks for the period of 2010q1-2015q4. For simplicity I chose only those entries which are likely to be “massaged” by managers rather than take every line item from the reports. For each firm I used Sales, SGA Expenses, Depreciation, Net Income, Acc/Receivable, Inventories, Total Assets, Acc/Payable, Deferred Revenue, Accrued Liabilities, and Total Liabilities.
Given the carnage in energy prices it is likely that we may catch some management of earnings.

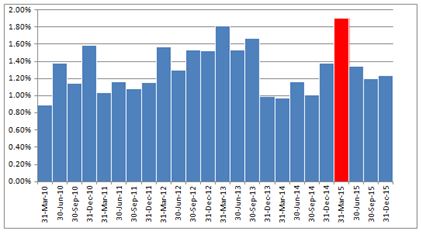
I calculated a time series of mean absolute deviations between expected and actual frequency of first digit in the reported numbers. Later on in the post I will outline exactly how we derive the expected values.
What becomes clear is that in the first quarter of 2015 it is very likely that reported earnings were “managed”. A real time analysis can quickly pick up unusual patterns for further analysis.
Benford’s Law and its Distribution Functions:
Benford’s Law reveals that, counter to intuition, the frequency of leading digits in a collection of numbers is not uniform. This means that a number that starts with a 1 is observed more often than a number that begins with a 2. The exact formula for the first digit is:
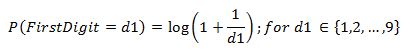
here the logarithm is of base 10.
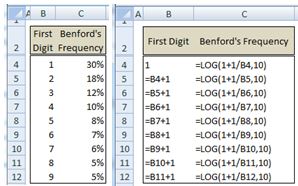
Below is a table of Benford’s frequency distribution for the first digit along with excel formulas used to compute it.
The formula for the distribution of the second digit is given by:
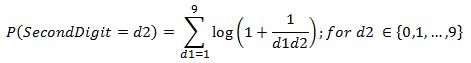
Again, the logarithm is taken with base 10. Below is a table of the frequency distribution in excel.

Plotting the two distributions we can see that the distribution of the second digit approaches a uniform distribution.
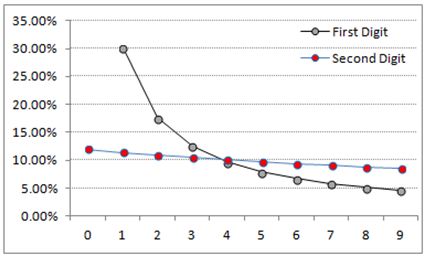
Third digits and higher are almost uniformly distributed and don’t really concern us here. For accounting fraud detection the first digit test is most often used among the single digit tests.
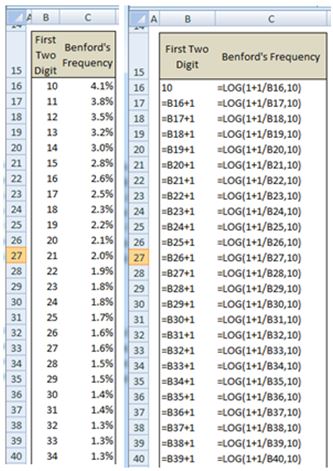
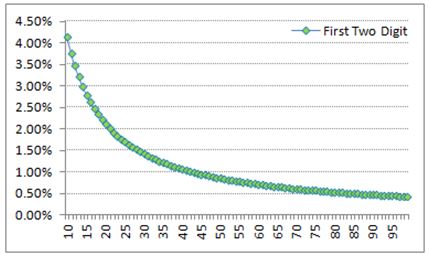
One more distribution that I want to mention here is the first two digits distribution. It is given by:

Below are the calculations in excel along with the plot of the distribution.
The key point to mention at this stage is that the reason why Benford’s Law is used in fraud detection is because the results are counterintuitive. One naturally thinks that leading digits should be uniformly distributed and therefore when accounts are manipulated they are manipulated in a way that is not consistent with the naturally occurring phenomena that Benford’s Law captures.
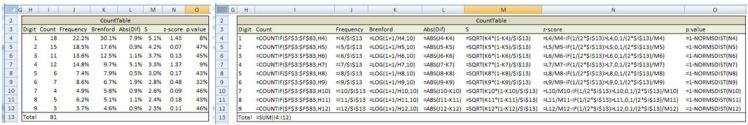
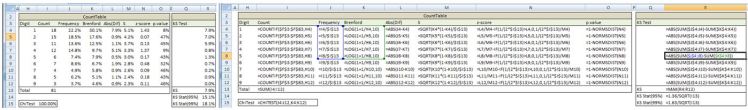
As an example let us calculate the actual frequency distribution of the 9×9 multiplication table and compare it to Benford’s distribution.
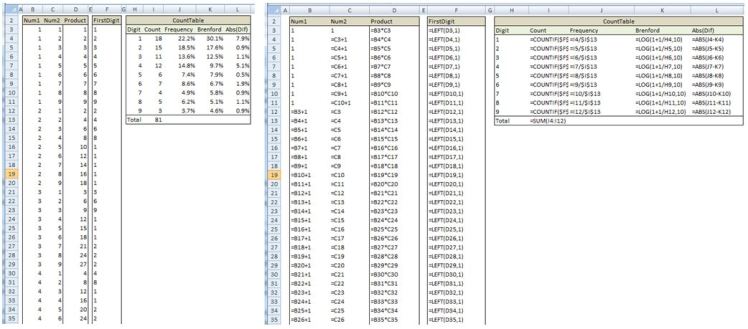

So we can see that there are deviations in the actual frequencies as compared to Brenford’s Law.
Statistical Tests:
After computing the actual frequency of leading digits we probably would like to know if any of the deviations are statistically significant. To test for this we can compute a z-statistic for each digit base on below formula:

where AP is the actual proportion and EP is the expected proportion. The denominator is the standard deviation and N is the number of observations. The second term in the numeration is a continuity adjustment and is used only when it is smaller than the first term.
The above test looks at differences between actual and expected proportions for each digit. Often times what we want to know is how well the entire distribution of actual proportions conforms to Benford’s Law. The two most common methods for testing this hypothesis is the Chi Square and the Kolmogorov-Smirnov (KS) tests.
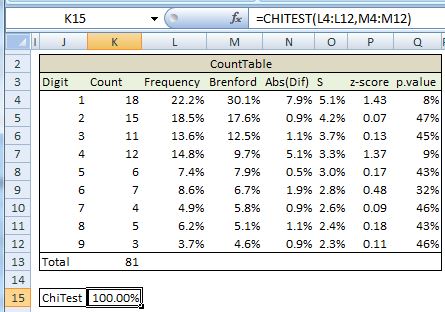
The Chi square test is a test of goodness of fit between observed and theoretical values. The test statistic is given by:
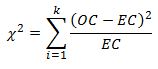
where OC is the observed count and EC is the expected count. We sum across k number of bins. For the first digit test k =9 while for the first two digits test k equals 90. Luckily we can perform the Chi square test in excel using native functions. In excel CHITEST function returns the probability of observing the test statistic. If the value is below a chosen significance level (for example 5%) then we can conclude that the observed first digit frequencies are statistically different from what we would expect under the null hypothesis of the frequencies coming from Benford’s distribution. In our example using the multiplication table we see that we cannot reject the null.
Another common test is the KS test. In this test we look at the cumulative distribution function to check for statistically significant deviations between an observed distribution and an expected distribution.
The test statistic is given by:
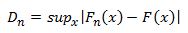
where Fn is the cumulative distribution that we observe and F is Benford’s cumulative distribution. sup is the supremum (in our case it is the max).
The calculations can be easily done in excel as shown below.
Once we have our test statistic we can reject our null hypothesis of the two distributions being similar if:

or equivalently

For a 5% significance K is set to 1.36 and for a 1% level of significance K is set to 1.63 (from statistic tables). In our example we fail to reject the null hypothesis that observed variables came from Benford’s distribution.
Applications:
As I already mentioned, these methods are used in forensic accounting and are actually admissible in the court of law. Usually an analyst would look at balance sheet and income statement and check to see if any numbers stand out. If the data does not conform to Brenford’s Law it is suggestive that some creative accounting took place.
The statistical methods I mentioned suffer when datasets are very small or very large. For small datasets we may not flag significant deviations from Benford’s distribution. In very large datasets we may flag even the smallest deviations. Below I provide resources that discuss forensic accounting in much more depth and Benford’s law is applied and analysed by the authors.
Finally, I should mention that when applying above formulas we should take the absolute value of each number when extracting the leading digits. This is done so that when we are using left or mid excel functions we are picking up the correct value. This should be obvious since the leading digit of -100, for example, is 1. Also, when we are dealing with decimal points we should multiply the value by some scalar like 10, 100, or 1000. This should also be obvious since the first two digits of 1.2 are 1 and 2. Therefore when we multiply by 100 and apply LEFT(1.2*100,2) it will return 12.
Some Useful Resources:
1) Interesting article that makes suggestions about when this type of analysis might be useful and when it is unlikely to help ~ “The Effective Use of Benford’s Law to Assist in Detecting Fraud in Accounting Data” https://www.agacgfm.org/AGA/FraudToolkit/documents/BenfordsLaw.pdf
2) Mark Nigrin article in Journal of Accountancy discussing Benford’s Law ~ http://www.journalofaccountancy.com/Issues/1999/May/nigrini.htm
3) Using SPreadsheets and Benford’s Law to Test Accounting Data ~ http://www.isaca.org/Journal/archives/2010/Volume-1/Pages/Using-Spreadsheets-and-Benford-s-Law-to-Test-Accounting-Data1.aspx
4) Excellent book that is very thorough in its discussion of the history of Benford’s Law and its application ~ Forensic Analytics by Mark Nigrini http://as.wiley.com/WileyCDA/WileyTitle/productCd-0470890460.html
5) Wikipedia https://en.wikipedia.org/wiki/Benford’s_law
6) Kolmogorov-Smirnov test entry on Wikipedia https://en.wikipedia.org/wiki/Kolmogorov%E2%80%93Smirnov_test

On a related topic for a small spreadsheet and VBA implementation of the Benford Bias Ratio see here https://www.academia.edu/6135263/Benford_Bias_Ratio_VBA_2014
LikeLike
thank you
LikeLike
Hi,
Thank you for a very nice explanation of Benford’s law. I am trying to understand the calculations pertaining to statistical test Chi Squared and K-S test. The font of the screen shots of XL spreadsheets is very small. IS there some place where I can get your spreadsheet example of Chi squared and K-S tests.
Thanks
San
LikeLike