Recently there’s been increased chatter about possible US recession and trouble brewing in the credit markets. I linked below to a typical article out of FT on economists’ assigning a 20% chance of a recession in US. Now I don’t want to dismiss the weak data that is coming out of the US and fully anticipate mediocre growth and disinflation pressures but a recession seems extremely unlikely.
A logit classifier that does a pretty good job of identifying historical recessions with a 3 month lead assigns negligible probability of a recession (NBER defined recession). In the model fundamentals are used rather than market/sentiment inputs since they are way too noisy. Main factors are :
- Real Fed Funds
- Equity Returns
- Various Employment Growth Statistics
- TED spread
- Housing Data
- Energy Price Pressure
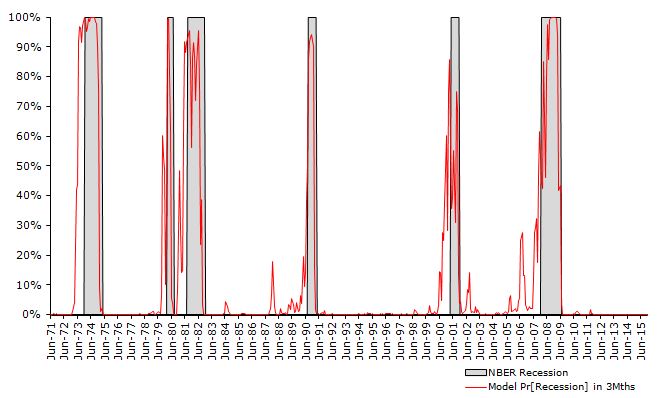
Similar models that use the yield curve assign a higher probability but in my mind this is a faulty method and I don’t bother including it in the model.
If you are to accept the premise that the chance of a recession is marginal, then I believe it’s worth dipping a toe to counter the credit spreads that we see today in the investment grade space. I am sure that there are also lots of opportunities in the High Yield sector but we really need to parse the data to tease out firms that are truly in trouble (especially in the energy and commodities sectors).
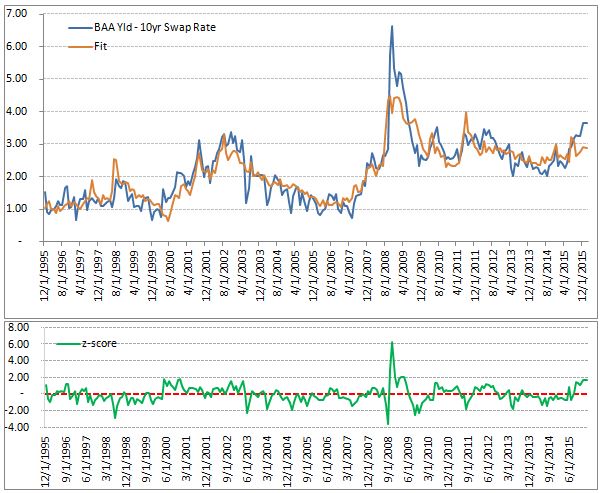
My model for the BAA Index over 10 year swap rate shows that the spreads are too wide while controlling for major economies’ growth, outright level of yields, monetary policy rate, and equity vol. As can be seen below, spreads are too wide given our attributes.
Looking at a single regression model to decide on a trade is obviously insufficient so let’s look to at least present a narrative that counters the dominant view that is currently prevailing. If we convince ourselves that our counter narrative is at least as plausible as conventional thinking then we can at least gain confidence and add confirmation to the signal form the model.
I hope you agree that the appropriate place to look is at earnings and leverage ratios that currently prevail in the US.
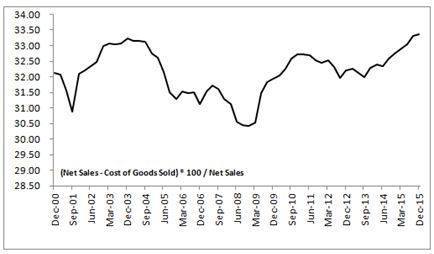
Overall, gross margins are hovering around all time highs.
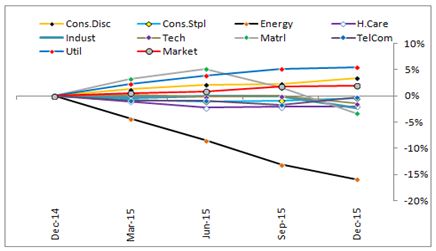
Year on year percent change in the ratios have been marginal across sectors with the big exception of energy.
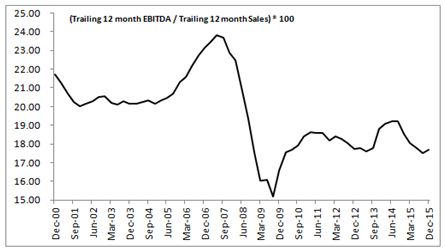
Profit margins (EBITDA/Revenue on a trailing 12 month basis) are at the bottom of the recent range but ticking up slightly.
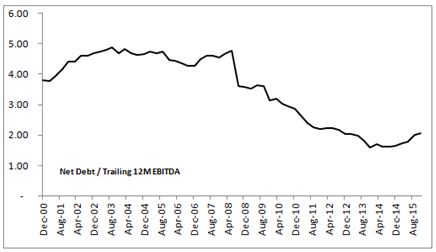
Net Debt to EBITDA is increasing since 2013 but net leverage of S&P 500 is still low relative to its own history.
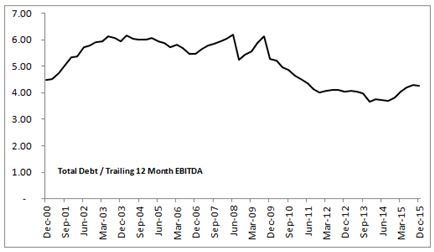
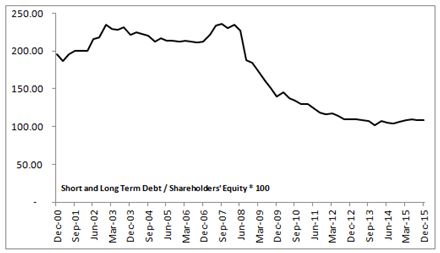
The same story is told by the charts of Total Debt over EBITDA and Total Debt over Equity.
And as everyone has already heard ad nauseam, US firms have been hoarding loads of cash. The trend is reversing itself but there is hardly any sign of worry here.

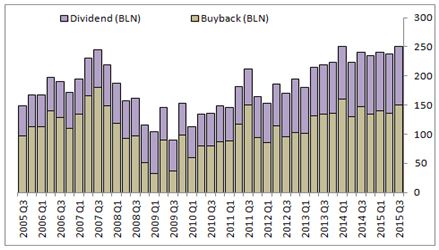
Finally, let’s remember that firms have space to reduce the cash that they have been returning to investors via buys backs and dividends.
Also, credit growth has tempered to slowest pace since 2010 and should help with spread tightening.

One additional point, even though I believe there is value in receiving the IG spread it is likely that disappointing data may persist for some time. As can be seen below, there is pronounced seasonality to Citi’s data surprise index and this year may very well repeat this trend.

In the current environment, IG spread compression trade is similar to a paid position in rates or a short equity vol trade so cautiously building into the trade is important.
** FT article “Economists see 20% chance of US recession ~ http://www.ft.com/intl/cms/s/0/da2ed38a-c6bd-11e5-b3b1-7b2481276e45.html#axzz3yteu8USW
