My posts have been spars as I adjust being back home. Today’s post will be about a somewhat gimmicky approach to visualizing correlation in the markets. A while back I came across an interesting article by Resovsky et al on minimum spanning trees. I do not have a background in graph theory but I have sampled some of the literature for fun. Below is a quick note on graphs and a particular algorithm to generate a minimum spanning tree along with some results from R’s interesting igraph package. Hope you enjoy.
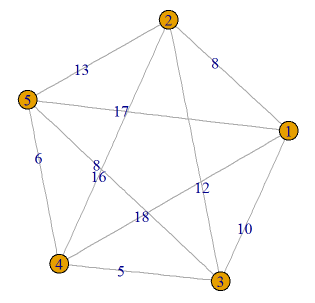
In the article Minimum Spanning Tree Application in the Currency Market, Resovsky et al apply a minimum spanning tree algorithm to selected currency pairs in order to visualize close linkages. They report below graph (link to their paper is at the end of the post).

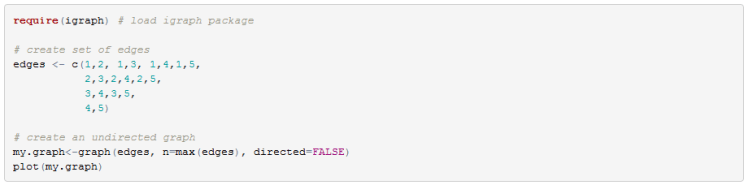
I will try to show here how we can perform similar analysis using R.
Prior to jumping into the code I provide some background on graph theory and minimum spanning tree algorithms.
Graphs:
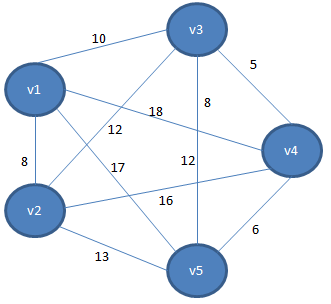
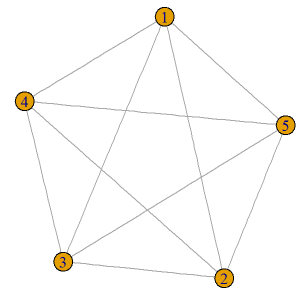
A graph is a pair of sets (V,E) where V is a set of vertices and E is a set of edges that are formed by a pair of vertices. Vertices are also sometimes referred to as nodes. An example of a graph with vertices V ={v1,v2,v3,v4,v5} and Edges E= {(v1,v2), (v1,v3), (v1,v4),(v2,v3),(v2,v4),(v2,v5), (v3,v4),(v3,v5),(v4,v5)} is shown below:
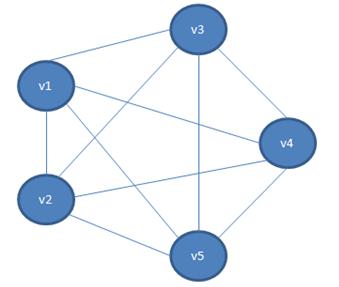
Each edge is represented as a line that joins a pair of vertices. A graph does not need to be fully connected. Some vertices may have no edges. Below is an example:
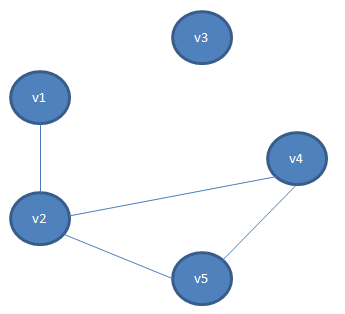
The two graphs that were shown so far are examples of undirected graphs. That is, there is a symmetrical relationship between vertex v1 and v2 in the above graph. We can go from v1 to v2 and similarly from v2 to v1. You can think of this graph as each vertex representing a city and an edge is a two way road. Graphs can be directional and we represent that with an edge that has an arrow.
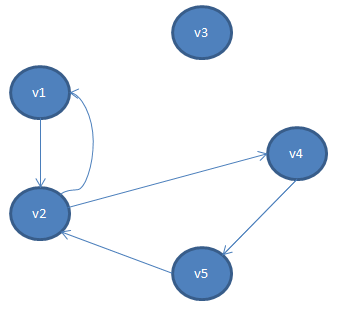
In the directed graph above, the only way to get to v4 is from v2. Think of this graph as cities connected by one way streets.
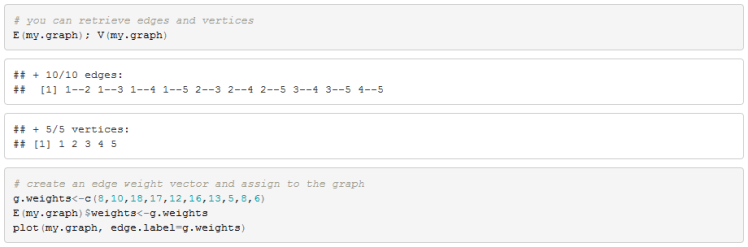
A graph can be weighted also, in this kind of graph, each edge has a weight assigned to it.
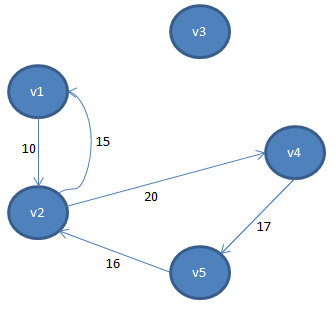
In this graph you can think of the weight as distance, or time it takes to travel from a city. A weighted graph can have directional edges or it can be undirected. There is much more to graphs and I provide some resources at the end of the post. But I think this covers the core concepts that we need to proceed to replicate some of the work of Resovsky et al.
Minimum Spanning Trees (MST):
A MST is a subgraph of an undirected graph that connects all the vertices with the smallest sum of its edge weights. We can think of this as a shortest path between cities that are all joined by two way roads. In below diagram you can see a graph in grey, and a minimum spanning tree in black. You can see that all the vertices are joined, and it is a minimum spanning tree with a total weight of 38. If you try to remove any of the black edges and substitute a grey edge in a way that all vertices are still connected, the sum will be more than 38.
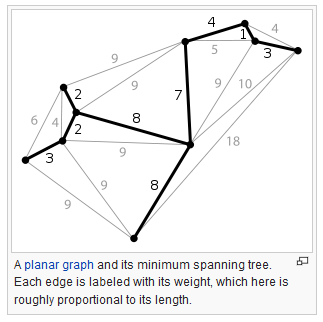
The above graph was obtained from Wikipedia: https://en.wikipedia.org/wiki/Minimum_spanning_tree#/media/File:Minimum_spanning_tree.svg
There are different algorithms that exist for find a minimum spanning tree. Here I will quickly describe Prim’s algorithm.
Step1: Select a vertex from graph to start the tree growing algorithm.
Step2: While the tree does not contain all the vertices of the graph find the edge that has the smallest weight leaving the tree and add it to the tree.
Step3: End the recursion when all vertices belong to the MST
Worked Toy Example:
Lets manually go through Prim’s algo for below graph
Starting at vertex v1 we have one vertex in our MST V set {v1}. We have 4 edges that start from v1 and the one with the smallest weight is the one that is leading to v2 with a weight of 8. We add this vertex to our set V ={ v1, v2} and our MST has one edge E= {(v1,v2)}.

Now we find the smallest weight from either v1 or v2 that connects to any of the vertices that are still not in our tree. You can see that the smallest weight is 10 which belongs to the edge between v1 and v3. Therefore we update our V set to include the new vertex {v1,v2,v3} and our edge set is E= {(v1,v2),(v1,v3)}.
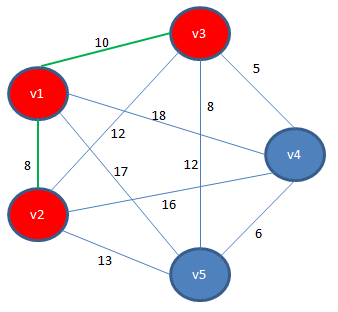
Now the total weight is 18. We continue adding vertices and edges in a similar fashion:

And finally

So we are left with a minimum spanning tree that connects all the vertices and has a sum of weights that is the smallest out of all possible spanning trees.

Example in R:

Minimum Spanning Tree using correlation:
Now we have enough background to understand graphs, minimum spanning trees, and R implementation of graphs to be able to perform analysis that is close in spirit to Resovsky et al.
I chose to use 1week worth of intraday price data for G10, LatAm, Asia, and EMEA currencies (all against the USD). I also included some major stock indices and precious metals prices. I also chose to use rank correlation instead of Pearson correlation. And finally, note that since we are minimizing the weights in the MST I chose to use 1 minus the absolute value of rank correlation as the distance measure. The reason I used absolute value is so that large positive and large negative correlation is treated on equal footing as we run our algorithm. With that, I present the code below.

And we finally get our MST for the correlation matrix. I realize this is a bit gimmicky and it is not obvious if this approach is better than using clustering to pick up highly correlated clusters (I actually suspect this approach is not useful). After looking around online, I found that discussion of graph implementation in R and their application to the markets are rare enough that it might be worth posting so that others don’t have to reinvent the wheel.
I am new to Graph theory so if you spot errors please let me know.
Some Useful Resources:
- The article I cited at the beginning of the post. “Minimum Spanning Tree Application in the Currency Market” http://www.nbs.sk/_img/Documents/_PUBLIK_NBS_FSR/Biatec/Rok2013/07-2013/05_biatec13-7_resovsky_EN.pdf
- Wikipedia entry for MST https://en.wikipedia.org/wiki/Minimum_spanning_tree#Algorithms
- Documentation for R’s igraph package http://igraph.org/r/
- Online lecture on MST http://videolectures.net/mit6046jf05_leiserson_lec16/?q=Go
- Interesting book that I only recently started but had to put down and will definitely get back to it. All about graph theory “The Fascinating World of Graph Theory” http://press.princeton.edu/titles/10314.html
- A book that deals with the Traveling Salesman Problem that is very interesting. Touches on MST. “In Pursuit of the Traveling Salesman: Mathematics at the Limits of Computation” by Cook. http://press.princeton.edu/titles/9531.html

I see you don’t monetize asmquantmacro.com, don’t waste your traffic, you
can earn additional bucks every month with new monetization method.
This is the best adsense alternative for any type of website (they approve all websites),
for more info simply search in gooogle: murgrabia’s tools
LikeLike