In a previous post I discussed k-means clustering, which is a type of unsupervised learning method. Today I want to add another tool to our modeling kit by discussing hierarchical clustering methods and their implementation in R.
As in the k-means clustering post I will discuss the issue of clustering countries based on macro data. Below is the data:

The best way to understand what unsupervised learning means is to contrast it with supervised learning. In supervised learning we have a response variable which we are trying to predict. A classic example is the Y variable in linear regression Y=alpha+Beta*X. All supervised machine learning techniques have a target variable and some features as inputs. We then attempt to learn the parameters of the model that best predict the target variable. In unsupervised learning methods, we do not have data labels. All we have are the Xs from which we want to learn something interesting about the dataset. Most common unsupervised learning technique is clustering. With clustering we are attempting to find some subgroups (clusters) in the dataset. There are many clustering techniques, but the most popular are the k-means and hierarchical clustering. Both techniques attempt to learn clusters of data where each cluster has ‘similar’ data points while at the same time difference between clusters is significant.
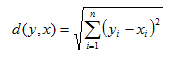
Before performing any clustering we need to define ‘similarity’. For this purpose distance measures are often used. For two vectors y=(y1,y2,y3…,yn) and x=(x1,x2,x3…,xn) some of the most common are:
- Euclidean Distance:
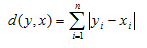
 2. Manhattan Distance:
 3. Minkowski Distance:

Notice that Minkowski distance equals Euclidean distance when p =2 and is the same as Manhattan distance when p =1.
Now that we have our choice of distance measures we can decide on a clustering algorithm. Those data points that have the smallest distance should be grouped together, and those that have a large distance should belong to different clusters. In k-means clustering the analyst decides on the number of clusters to use and then proceeds with the algorithm to assign each observation to one of the k clusters that has the shortest distance to it. This presents a problem if there is no obvious a priori choice for the number of clusters. Hierarchical clustering overcomes this problem. I will discuss agglomerative clustering algorithms that cluster from the bottom up.
The algorithm for agglomerative clustering performs the following computations:
- Begin with n clusters for each observation and compute all pairwise distance measures
2. Iterate through i=n, n-1…,2
-Identify two clusters that have the least distance between them and combine them to form a new cluster. This leaves i-1 clusters
-Calculate distance between remaining i-1 clusters
So we start with each observation belonging to its own cluster. We then find two observations that are closest together and fuse (combine) them to create a new cluster. At this stage we have n-1 clusters. What I have not mentioned yet is how we calculate a distance between fused clusters. There are many linkage methods but I will mention two here. Assume we have cluster A and cluster B and each have at least 1 observation assigned to them
- Average Linkage: Computes pairwise distance between observations in cluster A and B and then takes the average of those distances
- Complete Linkage: Computes pairwise distance between observations in cluster A and B and then takes the largest of those distances
After we compute the distance between clusters we fuse those two that have the smallest distance. The next loop of the algorithm begins.
Let’s begin to work though our data to see how this works. First notice that some of the data is missing. We have NAs for Industrial Production, Retail Sales, and C/A over GDP.
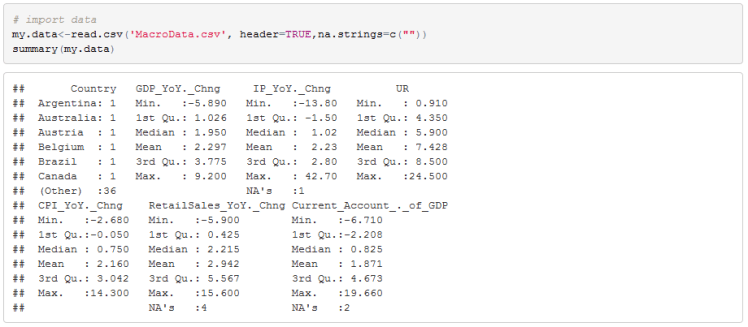
This often happens because some countries do not report all of the statistics that we care about. For example Malaysia, India and Philippines do not report retail sales. To impute the data I will use a cross sectional regression model to estimate missing observations as a function of YoY GDP growth. In R there is a package VIM that helps us do this.

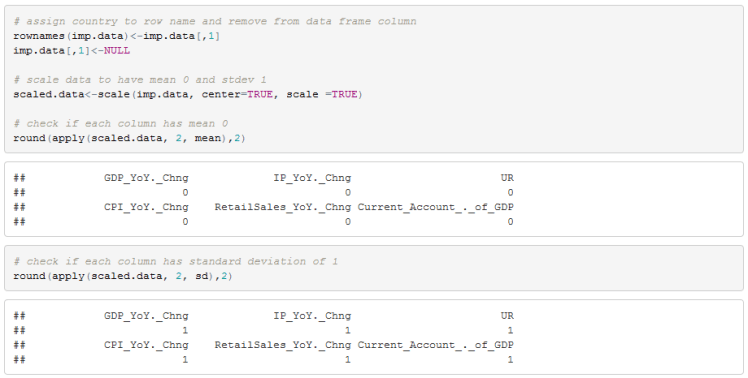
We now need to clean up the data frame by assigning row names and removing the country column. We also need to standardize the data. R’s scale function does this for us. Clustering is sensitive to the scale of the features so we need to standardize the data.
All we need to do now is compute the distance metric and run our clustering algorithm. We can also use a dendrogram to visualize the clusters.
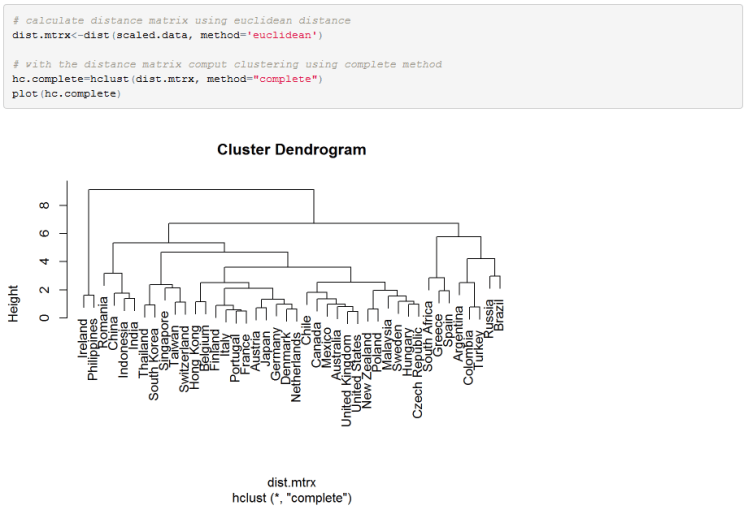
In the dendrogram, each leaf at the bottom represents all the observations (clusters) before we fuse any of them together. After one pass of the clustering algorithm, a pair of clusters is formed and it is linked in the dendrogram. The height of the measurement (vertical axis) shows the distance between clusters that have been fused. Therefore, if the link between two clusters is observed in the lower part of the dendrogram (small height) this means that the observations are similar and were fused at the early iteration of the algorithm. If clusters are fused higher in the dendrogram, this means the distance between the clusters is large.
Notice that the algorithm continued until there is a single cluster with all observations belonging to it at the root (top) of the tree. We can cut the dendrogram at any level to leave us with a chosen number of clusters. Unlike in k-mean clustering algorithm, we can have any number of clusters we like. For example, we can cut the tree to leave us with 8 clusters. This is how we would do it in R:

We can also create fancy dendrogram in R. I will include colours to highlight clusters.

Hope you enjoyed.
Useful Resources:
- Introduction to Statistical Learning http://www-bcf.usc.edu/~gareth/ISL/. Fantastic book and is available online. Includes R code and discusses many machine learning algorithms. Can’t say enough good things about this book.
- My post on K-means https://quantmacro.wordpress.com/2015/10/24/k-means-clustering-in-excel/
- Wikipedia entry on hierarchical clustering is very good https://en.wikipedia.org/wiki/Hierarchical_clustering
