As I sit here with a fresh pile of snow being dumped on Toronto I realised that most of my recent posts have been a little light on markets and a little heavy on machine learning. I am reluctant to let all those efforts go to waste so I thought we can use some of the work we have done on classification to see how it can be applied.
GS has been publishing their EQ-MOVE model for a few years now so I thought we can construct something similar in R. The model attempts to model the probability of a 5% rally or drop one month in the future. They use a multinomial logistic regression with 4 inputs:
- ISM New Orders Index (Source: Institute for Supply Management)
- Capacity Utilization (Source: Federal Reserve)
- S&P 500 ROE excl Fin and Util (Feature Engineering using data from bbg SPX Index MEMB page)
- S&P 500 FCF Yield excl Fin and Util. GS uses 6mth moving average (Feature Engineering using data from bbg SPX Index MEMB page)
My sample is shorter due to data availability. GS estimates the model for the period 1988-2014. I will use data from 1991-2014. The data is sampled on a monthly frequency. Our multinomial model will be specified as:
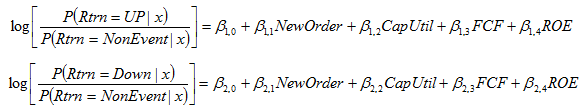
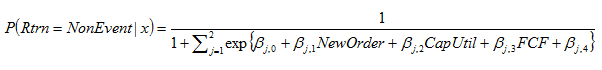
In the above equations, NonEvent is defined as a monthly return that is within -/+5% range. We can calculate the conditional probabilities from the specified log odds ratios as:

All we need to do is to define the probability of NonEvent. Since the conditional probabilities must add up to one (a particular month’s return will be either less than -5%, more than 5% or in the range -5%<Return>5% ). Using this fact about probabilities and above two equations we can derive the following:
From all this you can see that all that needs to be done is for us to estimate 2 equations with 5 beta coefficients each. Coefficients are estimated numerically using maximum likelihood estimation. Lucky for us R already has all of this implemented in the nnet package with the multinom function.
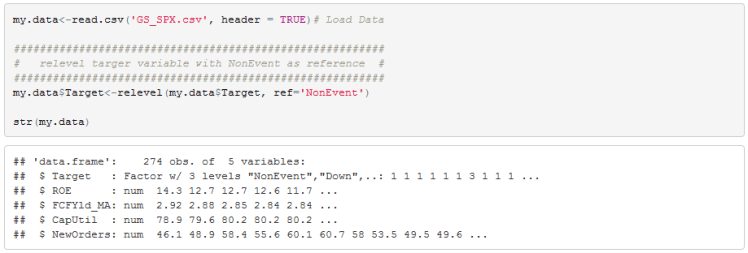
We first need to load the data and set the reference category. In GS_EQMOVE NonEvent is the reference category.
We can now estimate the model.

Now we can check what attributes the fitted model object has and find the name for the fitted values and inspect them.
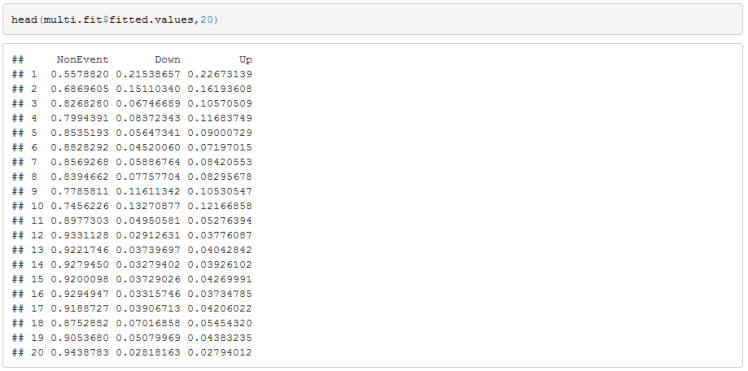
After using the fitted model to predict the probabilities up to April 2016 we can generate a chart that is qualitatively very similar to the GS-EQMOVE models

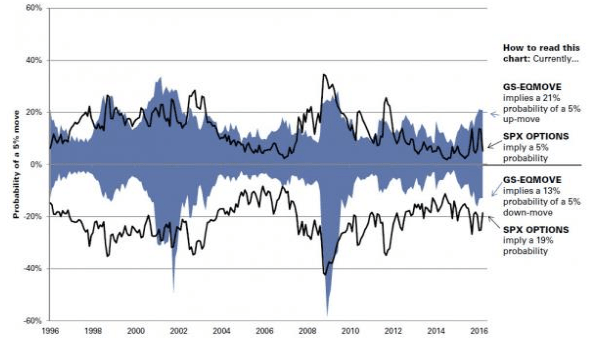
Our fitted model returns very similar probabilities as of start of March. The probability of a 5% rally in March was 22% and the probability of a 5% decline was 15%. This matched EQMOVE closely with a probability of a 5% up move of 21% and a probability of a 5% decline of 13%.
Finally, we can add two time series of 1month European digitals, a 105% call and 95% put. Bloomberg has data going back to 2006. Again, our results look similar.

Hope you enjoyed.
Useful Resources:
- GS-EQMOVE report as posted by zerohedge http://www.zerohedge.com/news/2016-03-07/jpm-goes-short-goldman-says-never-better-time-buy-sp-calls
- Wikipedia page describing multinomial logistic regression https://en.wikipedia.org/wiki/Multinomial_logistic_regression
- Nnet package description https://cran.r-project.org/web/packages/nnet/nnet.pdf

Does this regression based “fair value” model really useful in trading?
LikeLike
hi j, this is not a fair value model. we are not assigning a level to SPX but working out the probability of a ‘large’ return. Goldman’s research shows that this model outperforms options implied probabilities. They backtest various strategies using absolute and relative (to options) signals and report positive results.
LikeLike
Hi! I’m also trying to replicate this study, however I’m having trouble extracting the same FCFY and ROE times series that GS is using in the study. I’m currently using a solution using Bloomberg PORT (where I have a portfolio consisting of the SPX, then I exclude the GICS sectors Financials and Utilities, then PORT calculates FCFY & ROE). Do your times series of ROE and FCFY reflect GS’s? If so, can you please provide some more info regarding “Feature Engineering using data from bbg SPX Index MEMB page”? Bloomberg Help has not been able to help me much here. Best Regards, Rosie
LikeLike
Hello Rosie, yes there is a diff between bbg and gs data but they capture similar dynamics even though the levels are different. Bbg data seems incorrect (you cannot derive SPX PE from sector PE) and bbg staff cannot provide a satisfactory explanation for this. But even though there is a difference you can see from your results that the derived model probabilities are similar. I wouldn’t put much effort in trying to match GS exactly.
gluck
LikeLike
Hi, interesting work. Can you provide bloomberg tickers for those 5% probability moves or are they calculated from implied volatilities?
LikeLike